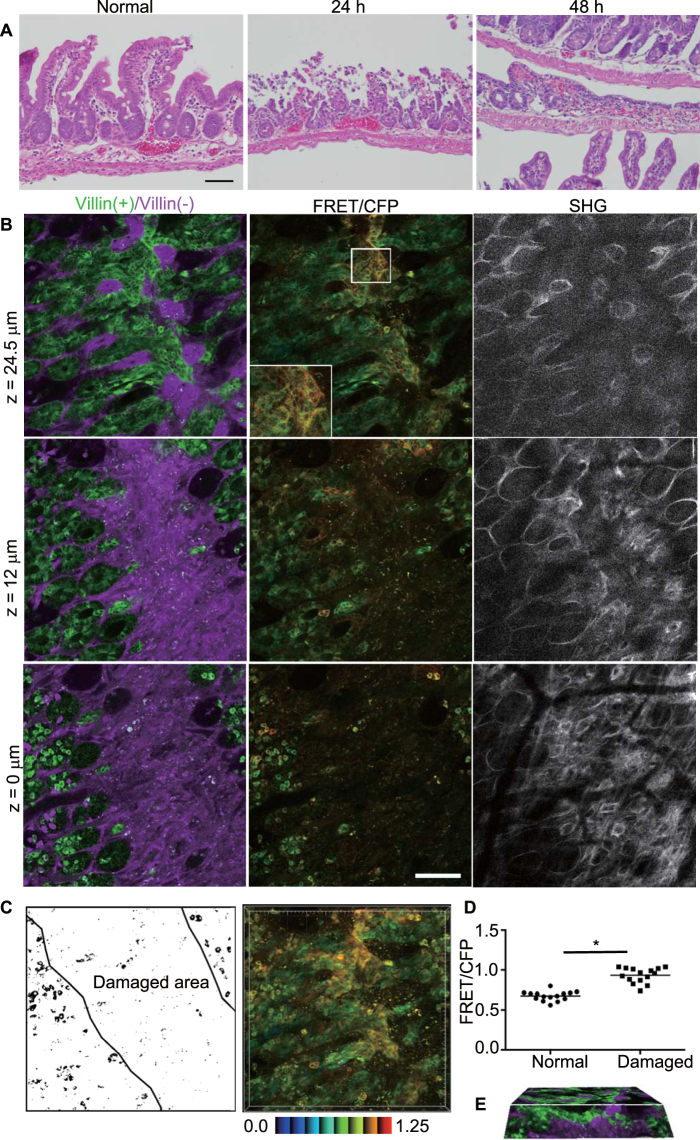
Figure 2.
Activation of Erk in the resealing epithelial cells in the ileum. (A) H&E staining images of the normal mouse ileum (left), and the damaged ileal epithelia at 24 h (middle) or 48 h (right) after ischemia. Bar, 50 μm. (B) Representative images of the damaged ileum 48 h after ischemia. A biosensor [green, denoted as Villin(+)] and the Keima protein [magenta, denoted as Villin(−)] and FRET/CFP and SHG images are depicted as described in Fig. 1B. (C) The schematic view of the damaged area and the three-dimensional projection image using FRET/CFP images. The colour bar indicates the FRET/CFP ratio in IMD with the lower and upper limits of the ratio range. (D) Comparison of the FRET/CFP ratio between cells in normal crypts (denoted as Normal) and resealing epithelial cells (denoted as Damaged) at z = 24 μm (p < 0.05; t-test). The graph shows the representative results from 9 independent experiments. The average FRET/CFP values for the 9 experiments were 0.714 (for cells in normal crypts) and 0.835 (resealing epithelial cells). (E) The cross sectional view of the three-dimensional reconstruction by 75 images taken at 1-μm intervals (Movie 2).

