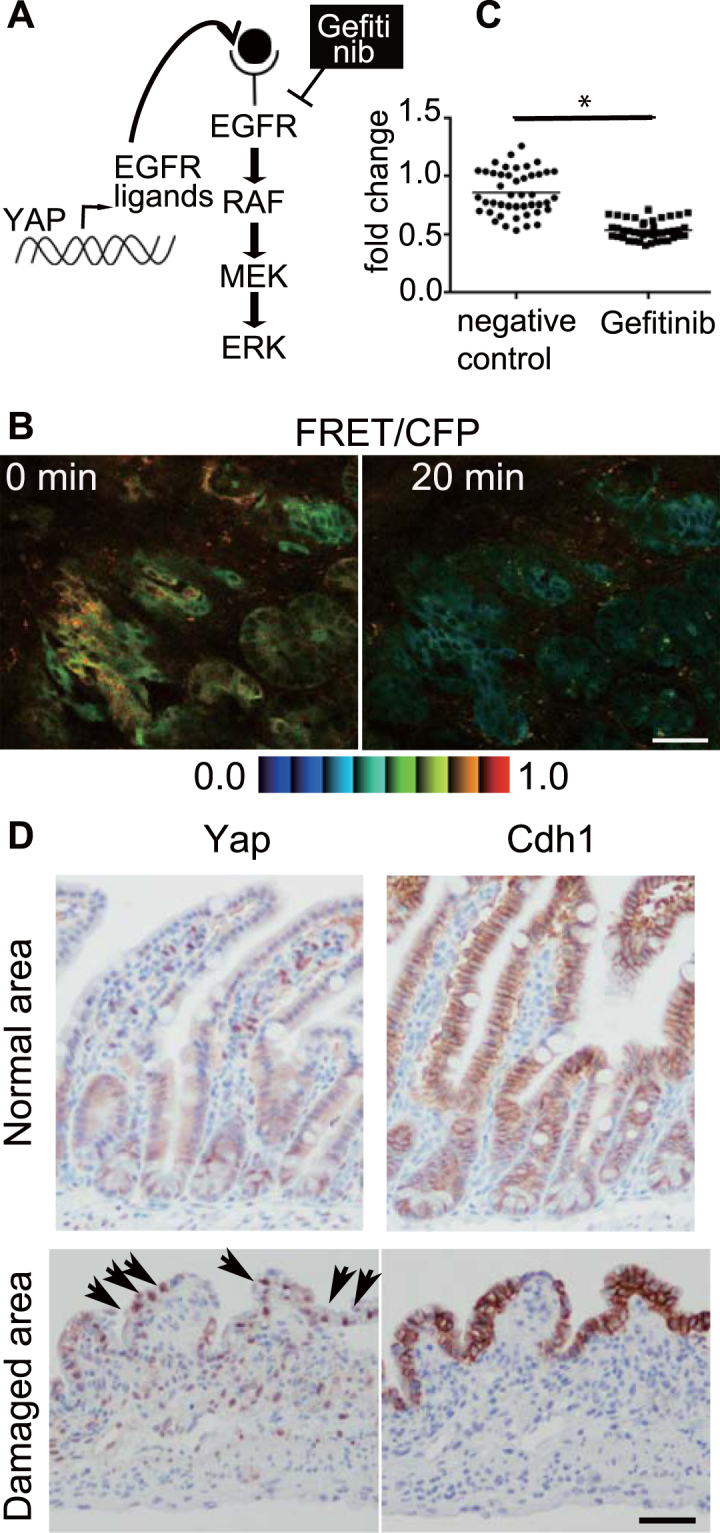
Figure 3.

Yap-Egfr-Erk axis in the resealing epithelial cells. (A) A schematic view of the Yap-Egfr-Erk signalling pathway and Gefitinib, an Egfr inhibitor. (B) A representative image of the FRET/CFP ratio of the resealing epithelial cells before (0 min) and after (20 min) Gefitinib treatment. The lower and upper limits of the FRET/CFP range are expressed with an IMD colour bar. Scale bar, 50 μm. (C) Three independent experiments were performed, and 13–15 cells were analysed in each experiment. The FRET/CFP ratio of individual cells at 20 min after treatment with solvent (denoted as a negative control) or Gefinitib was normalized to the FRET/CFP ratio before treatment (p < 0.0001, unpaired t-test). (D) The immunohistochemical images of Yap and Cdh1 in the normal ileum (upper panels) and 48 h after the ischemia (lower panels). Arrows indicate cells with Yap nuclear translocation. The images are representative of the 3 independent experiments. Bar, 100 μm.
