Figure 3.
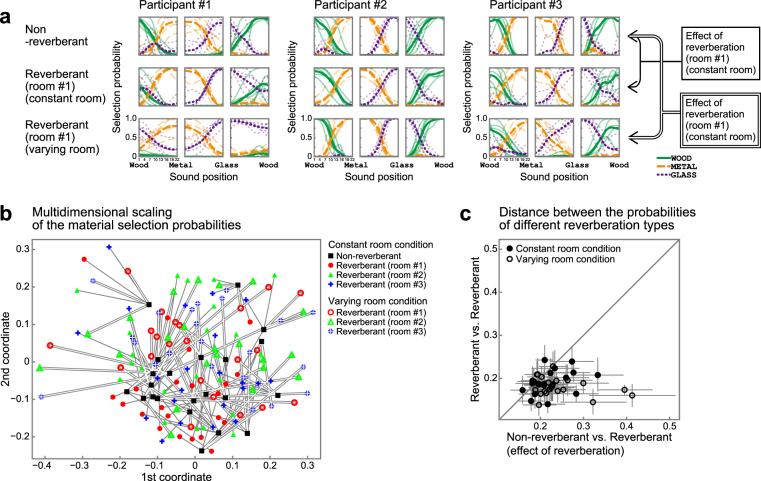
Material identification by individual participants. (a) Materials identified by 3 participants are shown as examples. With each participant, we show the probabilities of the selected materials for the non-reverberant sounds (top rows), the reverberant sounds in room #1 in the constant room condition (middle rows), and the varying room condition (bottom rows). Other conventions are the same as in Fig. 2. The functions were estimated with the kernel smoothing method as described in Materials and Methods. Generally, the psychometric functions differed markedly for non-reverberant and reverberant sounds (compare the panels vertically), indicating that material perception was affected by reverberation. The probabilities for the constant room and varying room conditions were also different, indicating the context dependence of the effect of reverberation. The effect of reverberation was defined by the distance between the probability for non-reverberant sounds and that for reverberant sounds, as illustrated on the right in the figure. The probability patterns varied among the participants, both for non-reverberant and reverberant sounds. (b) Multidimensional scaling of the material selection probabilities. Material selection probabilities under all conditions for all participants are plotted in the 2-dimensional space of the multidimensional scaling of the Hellinger distance. Black squares: responses to non-reverberant sounds, red circles: reverberant sounds in room #1, green triangles: in room #2, blue crosses: in room #3. Filled and open symbols represents the constant and varying room conditions, respectively. Dots for a single participant are connected with single (constant room condition) and double (varying room condition) lines. (c) Distance between the probabilities of different reverberation types. Distance between the responses to non-reverberant and the responses to reverberant sounds (abscissa) were larger than the distance between the pair of responses to reverberant sounds in different rooms (ordinate). Each dot represents a single participant. Filled circles: constant room condition, open circles: varying room condition. The error bars indicate the 95% bootstrap confidence intervals.

