Figure 7.
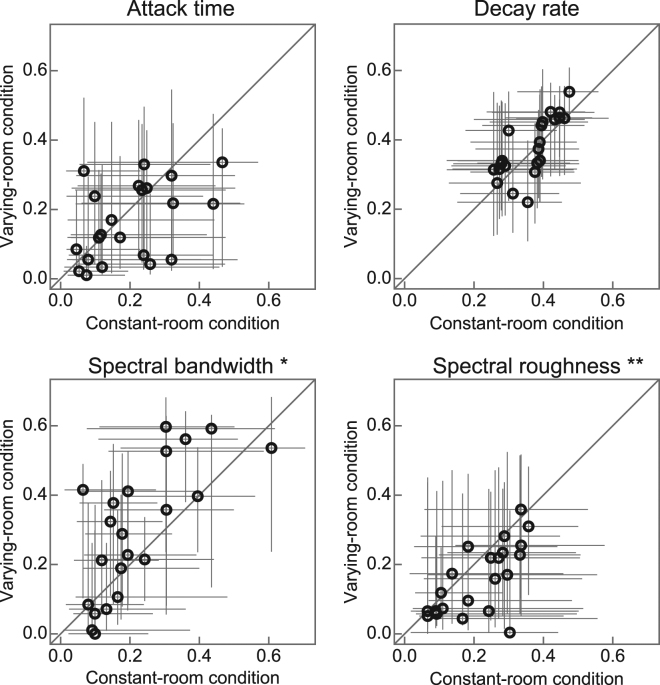
Contribution of acoustic features to material identification. Comparisons of the contributory weights on each acoustic feature under constant (horizontal axis) and varying (vertical axis) room conditions. Each panel represent one feature as indicated above the panel. Each circle represents one participant. The error bars indicate the 95% bootstrap confidence intervals. The contribution of the spectral bandwidth to material identification was larger under the varying room condition (p < 0.05), and that of spectral roughness was larger under the constant room condition (p < 0.01). The contributions of the attack time and decay rate did not differ statistically between the conditions (p > 0.1). **p < 0.01, *p < 0.05.

