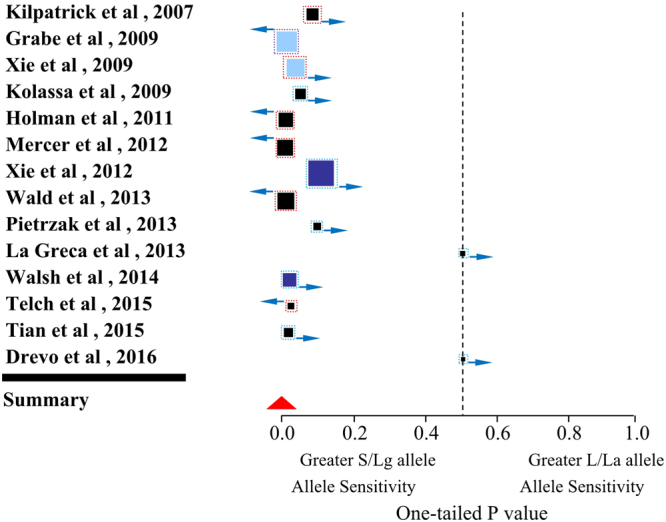
Figure 2.

Forest plot of 14 human observational studies for the interaction of 5-HTTLPR genotype and life stress on PTSD. The squares mark indicate the one-tailed P value for each study, where lower values denote greater stress sensitivity of S allele carriers and higher values correspond to greater stress sensitivity of L allele carriers. The size of the box reflects relative sample size. The red triangle indicates the overall result of meta-analysis. Black squares mark studies that indexed stressful life events; Dark blue indicates childhood adversity; and light blue indicates studies that included both stressful life events and childhood adversities; The squares with red border indicate S/Lg alleles; The squares with blue border indicate S alleles; and the squares with purple border indicate La alleles. The squares with w-resize indicate longitudinal studies and the squares with e-resize indicate cross-sectional studies.
