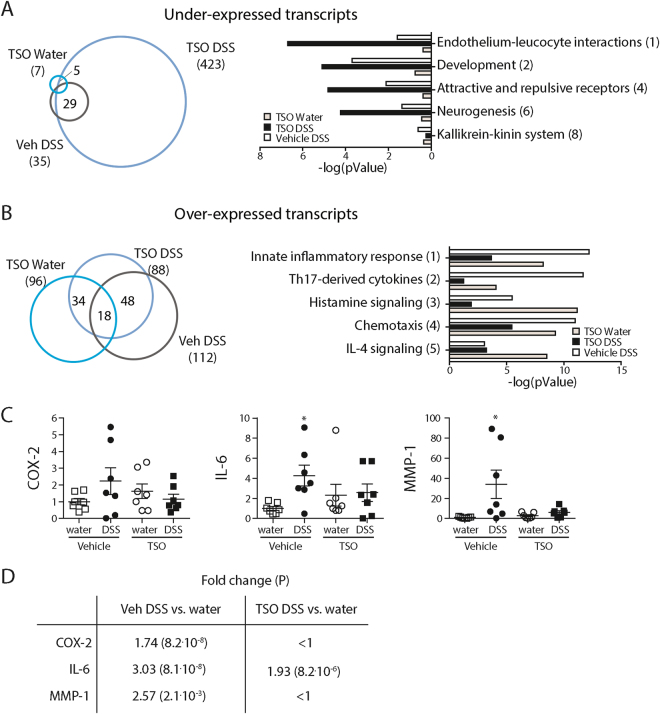
Figure 6.
Differential mRNA expression in LPMC. Genome wide expression analysis by RNAseq was performed with RNA from LPMCs isolated from rabbit caeca (n = three per group). Expression profiles of the different treatment groups were sorted by hierarchical clustering. Left) Number of under- (A) and over-expressed (B) mRNAs in the TSO DSS, Veh DSS and TSO Water groups in comparison to the control Veh Water group. Transcripts having a log2FC > |1| and P < 0.05 were considered as differentially expressed and included in further analyses. Right) Significantly affected Process Networks (PN) as identified by MetaCore™. PN without relevance to the investigated tissue and model were omitted. Numbers in parentheses provide the PN rank. (C) Validation of differential mRNA expression of COX-2, IL-6, and MMP-1 in LPMC (data pooled from two separate experiments, with n = 3–4 per group) by rt-qPCR. Expression was calculated with the ΔΔCt method relative to GAPDH and gave similar results as RNAseq (D). *P < 0.05, two-sided p-Value, Mann-Whitney test relative to vehicle water control if not indicated otherwise. Dots represent single animals, bars represent mean ± SEM.

