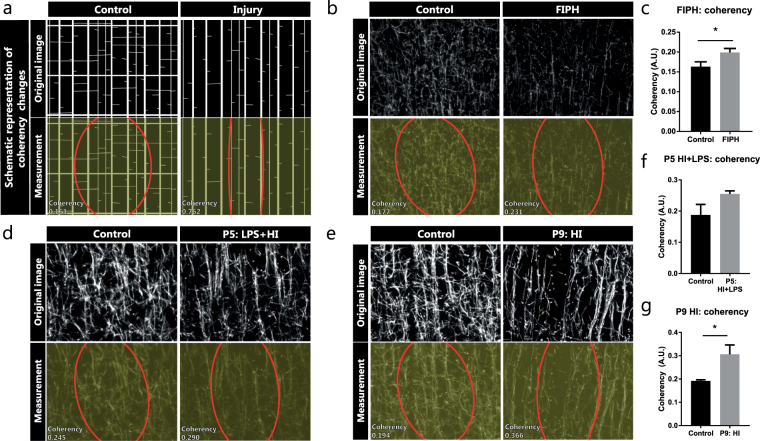
Figure 3.
Coherency as an inverse measure of complexity in the organization of myelinated axons. (a) Schematic representation of how a less complex organization causes increased coherency between myelinated axons. (b,d,e) MBP fluorescent signal (upper panels) and coherency measurement (lower panels) with coherency ellipse (red) of model-specific control animals (left) and rats exposed to fetal inflammation (LPS at E18 + E19) and postnatal hypoxia (P4) (FIPH; right b), or mice exposed to HI + LPS at P5 (right d), or mice exposed to HI at P9 (right e). (c) Bar graph showing increased coherency of myelinated axons in rats exposed to FIPH (n = 8 per group). (f) Mice exposed to HI + LPS at P5 do not show statistically significant changes in coherency of myelinated axons in the cortex (n = 6 per group). (g) Bar graph illustrating increased coherency of myelinated axons in mice exposed to HI at P9 (n = 8 per group). Data represent mean ± SEM; *p < 0.05.

