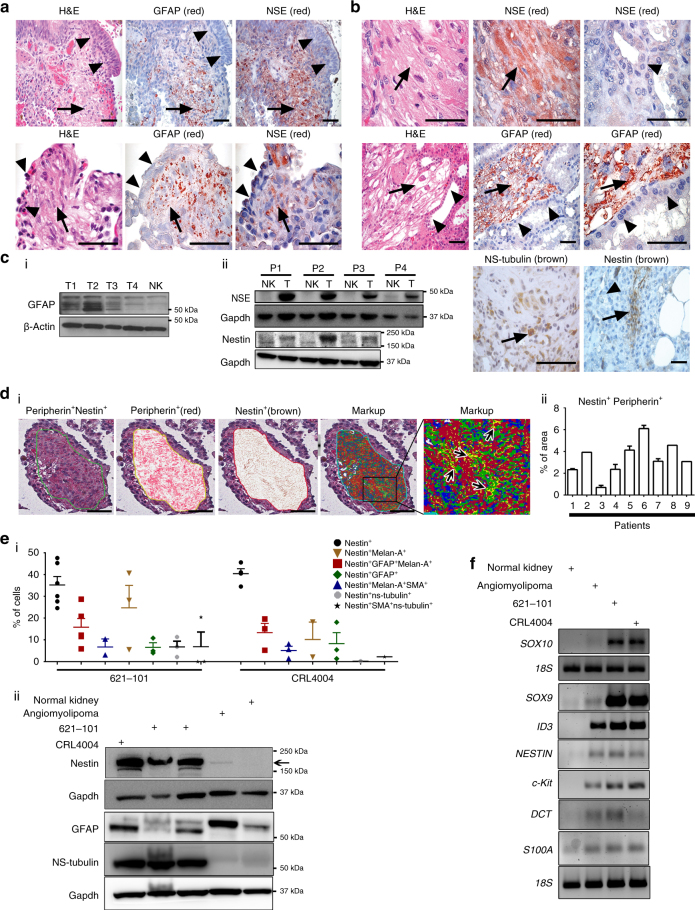
Fig. 1.
Multipotent progenitor and NSC-like profile of LAM and angiomyolipoma. a Hematoxylin and eosin (H&E) of the lung sections from sporadic LAM; GFAP or NSE expression in LAM. Arrows indicate LAM and arrowheads normal bronchial mucosa (upper) or normal pleura (lower images). b Sporadic angiomyolipomas (upper left and upper middle) and adjacent normal kidney (upper right) or TSC-associated (lower images) angiomyolipomas, stained with H&E or for NSE, GFAP, NS-tubulin, or nestin (arrows indicate angiomyolipoma and arrowheads kidney). c (i) GFAP, (ii) NSE and nestin expression in (i) TSC-associated and sporadic (ii) angiomyolipomas (T) from patients (P) vs. normal kidney (NK) by western immunoblotting. d (i) Nestin and peripherin expression in LAM (first left) and co-expression analysis by digital pathology; red indicates peripherin (second), brown nestin (third image), and yellow indicates co-expression of both markers (markup, right fifth panel: details within the area marked by the corresponding insert in fourth panel, black arrows). (ii) Quantification for data shown in d (i) by Aperio Digital Pathology; the percentage of area with co-expression of peripherin and nestin in LAM from 9 patients. Error bars are defined as means + s.e.m. e (i) FACS of cells grown in DMEM medium. Percentages of 621–101 and CRL4004 (angiomyolipomas-derived) cells expressing nestin alone or co-expressing: melan-A, GFAP, SMA, and NS-tubulin; (ii) Nestin, GFAP, and NS-tubulin expression in 621–101 (grown in DMEM or IIA complete medium), CRL4004 angiomyolipoma cells, angiomyolipoma tumor, and corresponding normal kidney by western immunoblotting. Error bars are defined as means + s.e.m. f q(RT)-PCR of SOX10, SOX9, ID3, NESTIN, c-Kit, DCT, and S100A1 mRNA levels relative to 18S in 621–101, CRL4004, angiomyolipoma tumor, and corresponding normal kidney. Data represent means (±s.e.m.). Data from nine LAM and eleven angiomyolipomas (a–d). Scale bar: 50 µm. *P ≤ 0.05, t-test. Data are representative of three to six (e (i)) independent experiments

