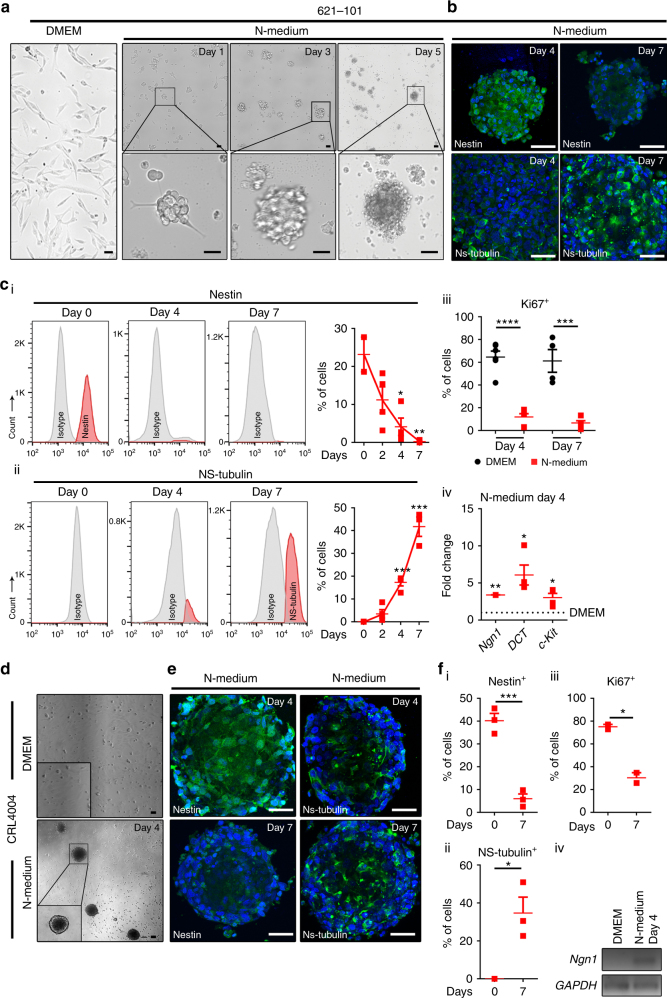
Fig. 3.
Neuronal differentiation of angiomyolipoma cells. a, d Brightfield images of a 621–101 and d CRL4004 cells in DMEM or N-medium. b, e Nestin and NS-tubulin in b 621–101 and e CRL4004 sphere-like structures in N-medium at day 4 and day 7 by immunofluorescence. c, f FACS of c 621–101 and f CRL4004 cells in N-medium. c, f Representative histograms and graphs showing percentages of cells in N-medium expressing (c (i), f (i)) nestin only and (c (ii), f (ii)) NS-tubulin only. c (iii), f (iii) Ki-67 in (c (iii)) 621–101 and (f (iii)) CRL4004 cells in N-medium vs. DMEM at days 4 and 7. c (iv), f (iv) q(RT)-PCR of Ngn1, DCT, and c-Kit mRNA relative to GAPDH in c (iv) 621–101 or f (iv) CRL4004 cells in N-medium vs. DMEM at day 4. Data represent means ± s.e.m. Error bars are defined as means + s.e.m. *P ≤ 0.05, **P ≤ 0.01, ***P ≤ 0.001, ****P ≤ 0.0001 by t-test. Data are representative of two (b, e), three, n = 3 (f (i–iv), c(iv)), four (d); n = 4 (c (i–iii)), and seven (a) independent experiments

