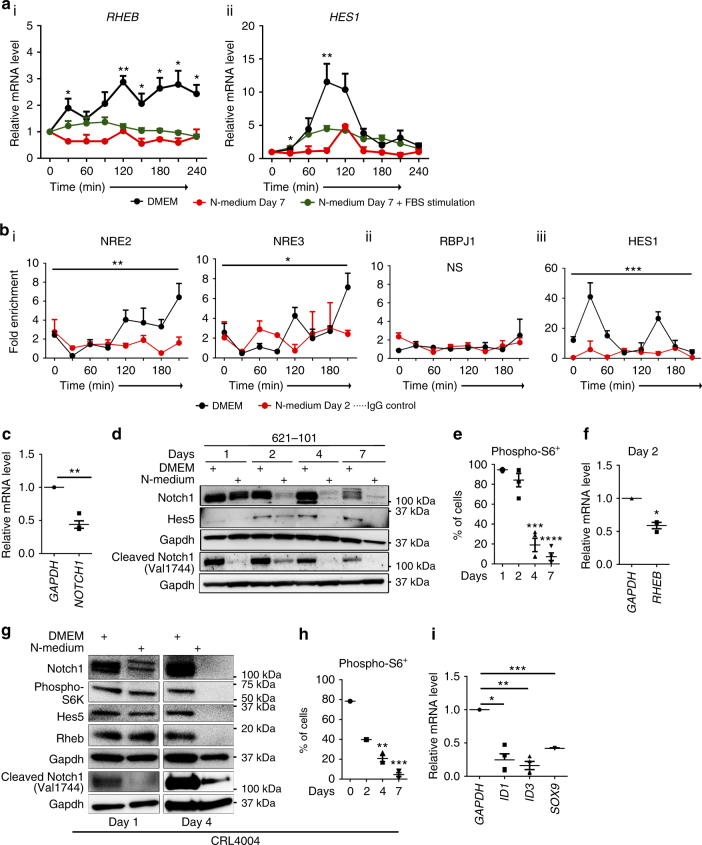
Fig. 4.
Suppression of Rheb and Hes1 oscillation associates with neuronal differentiation of angiomyolipoma cells. a q(RT)-PCR of (i) RHEB and (ii) HES1 relative to GAPDH in synchronized 621–101 cells in N-medium (released with chicken embryo extract (red lines) or serum (green lines)) vs. DMEM (released with serum (black lines)) (data from DMEM are also used in Fig. 2a (i–ii)). The statistical significance of RHEB and HES1 expression in DMEM vs. N-medium was determined between corresponding time points. b Binding of Notch1 to the (i) NRE2, NRE3, and (ii) potential RBPJ1 site within the Rheb or (iii) Hes1 promoter, in synchronized 621–101 cells in N-medium vs. DMEM at day 2 by ChIP-qPCR (data from DMEM are also used in Fig. 2e (i–iv)). Asterisks represent the statistical significance of mean of time points in DMEM vs. N-medium, two-way ANOVA. c q(RT)-PCR of NOTCH1 in 621–101 cells in N-medium at day 2, relative to DMEM (control) after normalization to GAPDH. d Western blot of Notch1, Hes5, and cleaved Notch1 (Val1744) in 621–101 cells in N-medium vs. DMEM. e Percentage of 621–101 cells expressing phospho-S6 in N-medium by FACS. f q(RT)-PCR of RHEB in 621–101 cells in N-medium at day 2, relative to DMEM (control) after normalization to GAPDH. g Western blot of Notch1, phospho-S6K, Hes5, Rheb, and cleaved Notch1 (Val1744) in CRL4004 cells in N-medium vs. DMEM. h Percentage of CRL4004 cells expressing phospho-S6 grown in N-medium by FACS. i q(RT)-PCR of ID1, ID3, and SOX9 in 621–101 cells in N-medium at day 2, relative to DMEM (control) after normalization to GAPDH. Data represent means ± s.e.m. Error bars are defined as means + s.e.m. *P ≤ 0.05, **P ≤ 0.01, ***P ≤ 0.001, ****P ≤ 0.0001, t-test (a, c, e, f, h, i), two-way ANOVA (b). Data are representative of two, n = 2 (i for SOX9); three (g); three, n = 2 (a, b (iii)); three, n = 3 (h); three, n = 4 (b (i, ii)); four (d), four, n = 3 (f); four, n = 4 (c, e, i for ID1, ID3)

