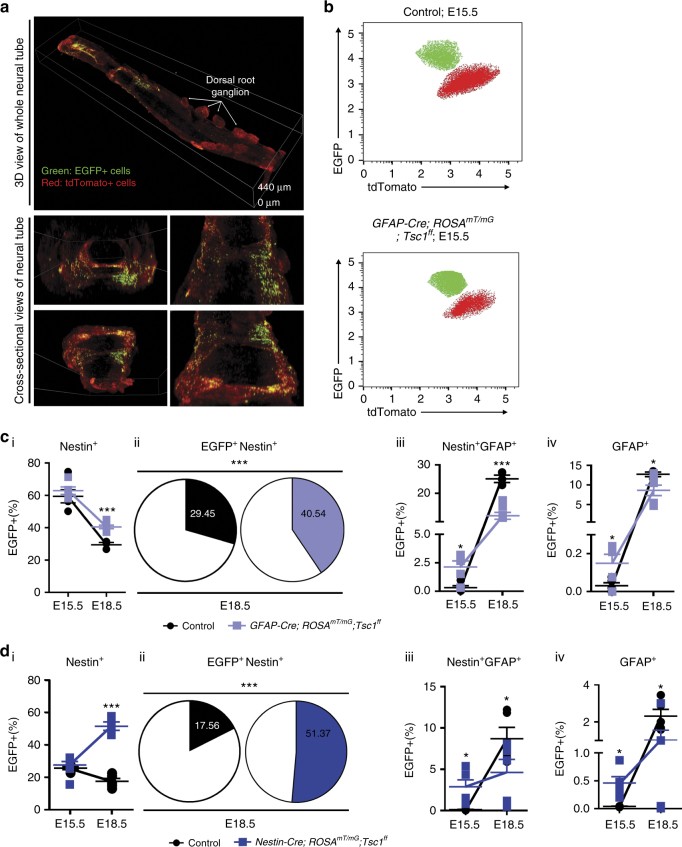
Fig. 5.
Loss of Tsc1 delays the differentiation of NSCs and RGCs. a Confocal microscopy of EGFP-positive (EGFP+) and tdTomato-positive (tdTomato+) NT cells in a ROSA mT/mG mouse NT. Maximum intensity projections from Z-stacks is shown. b–d FACS of EGFP+ NT cells in b, c GFAP-Cre;ROSA mT/mG (control) vs. GFAP-Cre;ROSA mT/mG ;Tsc1 ff embryos or d Nestin-Cre;ROSA mT/mG (control) vs. Nestin-Cre;ROSA mT/mG ;Tsc1 ff embryos. b Representative FACS plots of EGFP+ or tdTomato+ NT cells. c, d GFAP-Cre;ROSA mT/mG (control-black) vs. GFAP-Cre;ROSA mT/mG ;Tsc1 ff embryos (blue) (c) or Nestin-Cre;ROSA mT/mG (control-black) vs. Nestin-Cre;ROSA mT/mG ;Tsc1 ff embryos (blue) (d). (i) Change in the percentages of EGFP+nestin+ NT cells from E15.5 to E18.5 embryos. (ii) Charts representing EGFP+nestin+ NT cells at E18.5. (iii, iv) Change in the percentages of (iii) EGFP+nestin+GFAP+ or (iv) EGFP+GFAP+ NT cells from E15.5 to E18.5 embryos. Data represent means ± s.e.m.. Error bars are defined as means + s.e.m. *P ≤ 0.05, ***P ≤ 0.001 t-test. Data are representative of two experiments, nGFAP-Cre;ROSAmT/mG (E15.5 n = 5, E18.5 n = 3), nGFAP-Cre;ROSAmT/mG;Tsc1ff (E15.5 n = 5, E18.5 n = 7) (c (i–iv)); nNestin-Cre;ROSAmT/mG (E15.5 n = 4, E18.5 n = 5), nNestin-Cre;ROSAmT/mG;Tsc1ff (E15.5 n = 7, E18.5 n = 5) (d (i, ii)); nNestin-Cre;ROSAmT/mG (E15.5 n = 4, E18.5 n = 5), nNestin-Cre;ROSAmT/mG;Tsc1ff (E15.5 n = 6, E18.5 n = 5) (d (iii, iv)) embryos

