Figure 7.
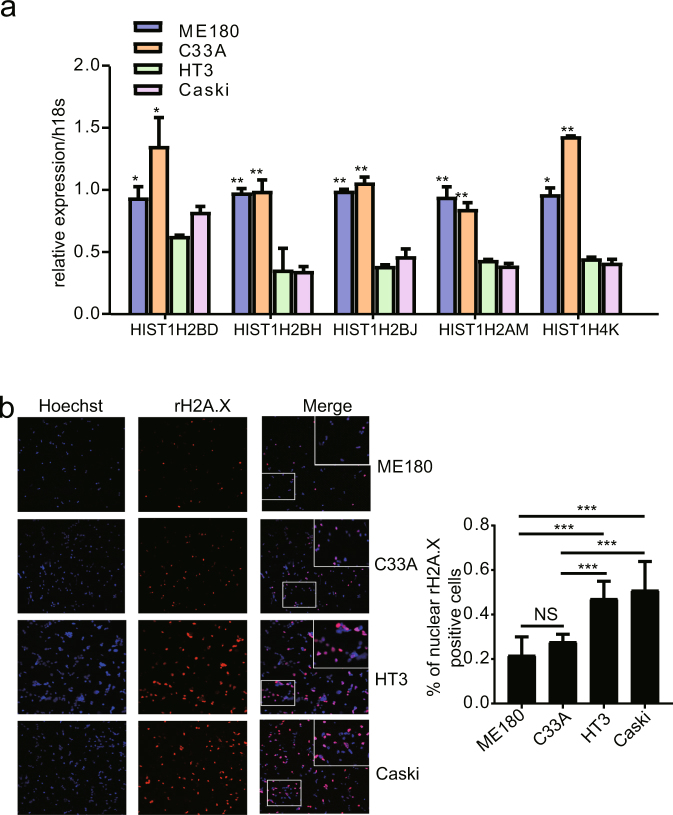
Functional experiments regarding the histone signature. (a) The expression levels of the 5 histone genes were determined in 4 HCC cell lines (ME180, C33A, HT3 and Caski). The histone gene expression level in the ME180 and C33A cell lines was significantly higher than that in the HT3 and Caski cell lines. (b) Micrographs showing the DNA damage marker γH2A.X in the cervical cancer cell lines mentioned above after treatment with 5 µM camptothecin for 2 hours. Non-treated images are not shown here. Cell nuclei are stained blue by Hoechst dye to indicate the cell number. The graph to the right of the micrographs shows the quantification of the proportion of cells with γH2A.X-positive nuclei among 600 cells from 6 images acquired using a 20X objective. The data were analyzed using the Analyze Particles tool in ImageJ; points larger than 30 pixels 2 were counted as a cell.

