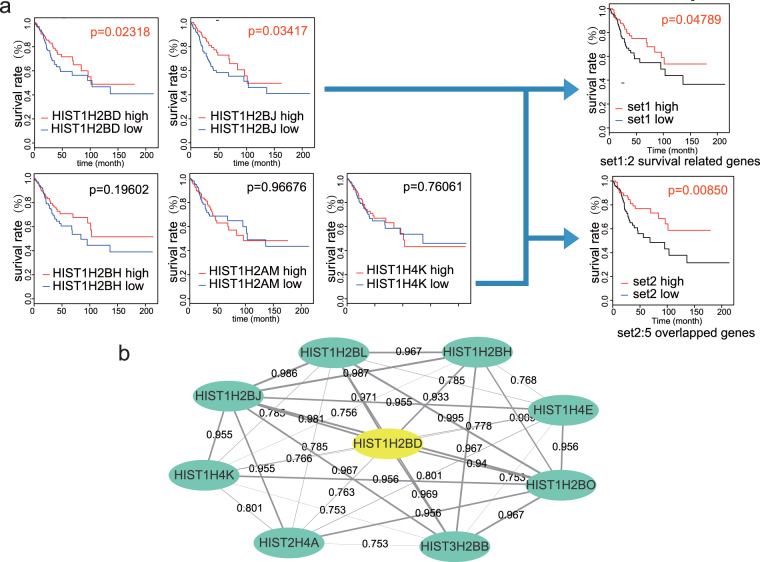
Figure 8.
Survival curves of 5 overlapped genes between the experimentally validated genes and the Oncomine data. (a) Kaplan-Meier survival curves of HIST1H2BD, HIST1H4K, HIST1H2BH, HIST1H2BJ and HIST1H2AM were used to explore the relationship between the expression of genes and the survival rate. The expression of HIST1H2BD and HIST1H2BJ was significantly correlated with the survival rate of cervical squamous cell cancer patients, with a p-value equaling 0.02318 and 0.03417, respectively. The expression of the other 3 genes was not significantly correlated with the survival rate. Survival analyses of two gene sets (HIST1H2BD and HIST1H2BJ; and HIST1H2BD, HIST1H4K, HIST1H2BH, HIST1H2BJ and HIST1H2AM) demonstrated that both gene sets were related to survival (p = 0.04789 and 0.00850, respectively). (b) Protein-PPI network analysis of histone genes enriched in the SLE pathway. HIST1H2BD, which acted as a seed gene, is marked in yellow. Nodes denote proteins, and edges denote interactions. The width of each line represents the combined-score of interaction between two nodes (the score is also marked on each edge).

