
Fig. 1.
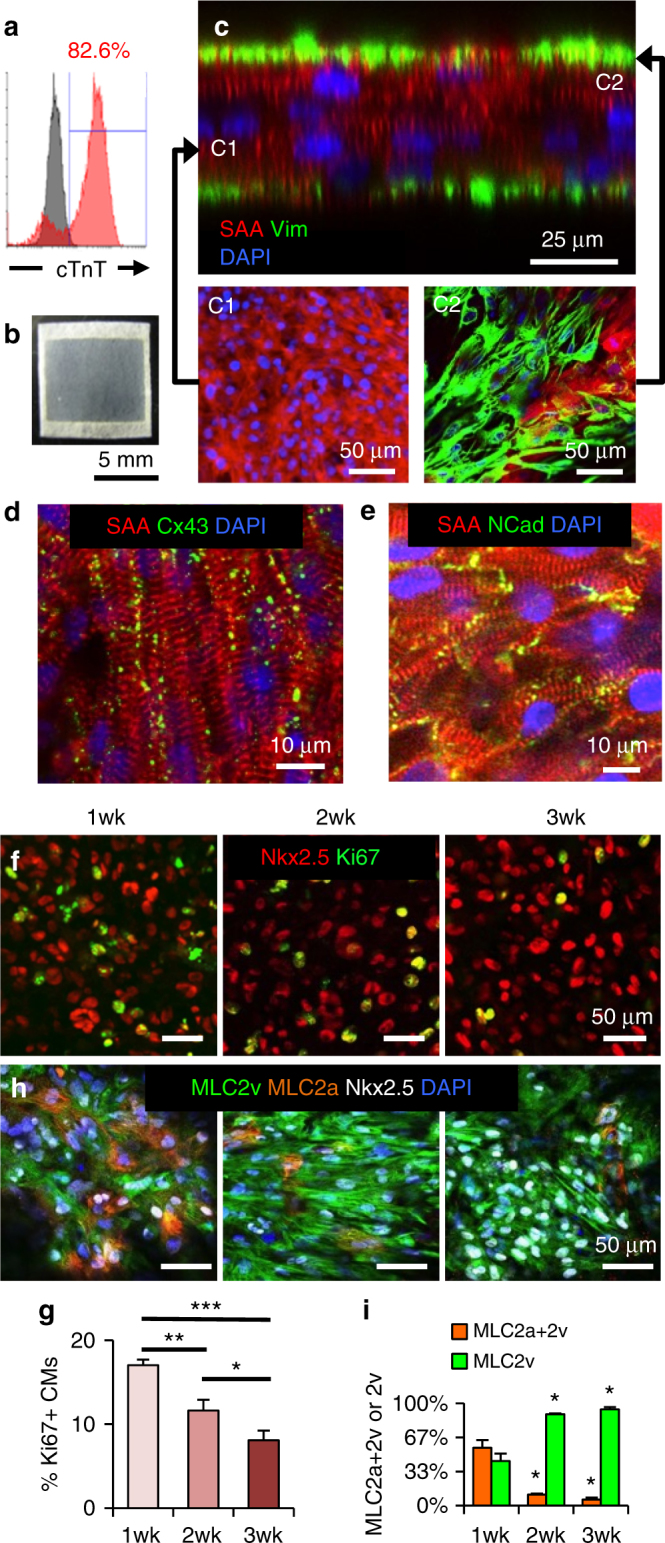
Structural characterization and maturation of hiPSC-CM cardiopatches. a Representative flow cytometry histogram from hiPSC-CMs after 20 days of differentiation. b Photo of a 7 × 7 mm hiPSC-CM-derived tissue patch (human “cardiopatch”) surrounded by a Cerex® frame. c Representative cross-sectional confocal image of 3-week-old cardiopatch demonstrating several layers of densely packed sarcomeric α-actinin (SAA)+ hiPSC-CMs (C1) surrounded by a layer of vimentin (Vim)+ fibroblasts (C2). d, e Representative confocal images of connexin-43 (Cx43, d) and N-Cadherin (NCad, e) junctions in cardiopatch. f, g Representative confocal images (f) and quantification (g) of Ki67+/Nkx2.5+ CMs after 1, 2, and 3 weeks of cardiopatch culture; n = 8/11/12 patches (for 1/2/3 week) from four differentiations; *p = 0.037, **p = 0.0033, ***p < 0.0001, post-hoc Tukey’s test. h, i Relative fractions of myosin light chain 2v (ventricular) and 2a + 2v (atrial/early ventricular) positive hiPSC-CMs within cardiopatches cultured for 1–3 weeks; n = 7/5/4 patches (for 1/2/3 week) from four differentiations; *p = 0.0002 vs. 1 week, post-hoc Tukey’s test. Data are presented as mean ± SEM. Scale bars b 5 mm; c 25 µm (C1–C2, 50 µm); d, e 10 µm; f–h 50 µm