Fig. 3.
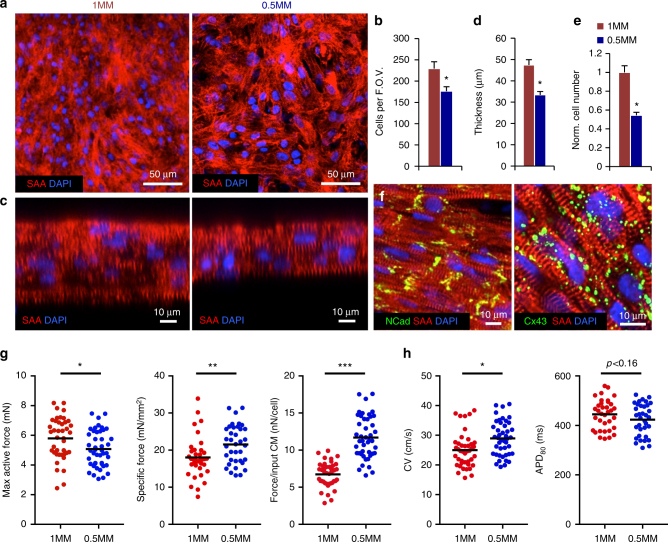
Lowering density of hiPSC-CMs improves cardiopatch function. a Representative confocal images of 3-week-old cardiopatches generated from 1 million (1MM) and 0.5 million (0.5MM) hiPSC-CMs stained for SAA. Scale bar 50 µm. b Quantification of average number of cells per field of view in 0.5 and 1MM cardiopatches using a ×63 objective (2 µm slice); n = 13/16 patches (1/0.5MM) from seven differentiations, three to four random fields of view per patch; *p = 0.0083, unpaired t-test. c Representative optical cross-sections of 1MM and 0.5MM cardiopatches. Scale bar 10 µm. d Quantification of cardiopatch thickness made from 0.5 and 1MM cells; n = 22/25 patches (1/0.5MM) from 7/11 differentiations, average 2 thickness measurements per patch; *p < 0.0001, unpaired t-test. e Calculated cell numbers in cardiopatches (normalized to 1MM patch) based on average patch thickness and cells per field of view; n = 13/16 patches (1/0.5MM) from seven differentiations; *p < 0.001, unpaired t-test. f Representative confocal images of 3 week 0.5MM cardiopatches stained for Cx43, SAA and NCad. Scale bar 10 µm. g Maximum active force, specific force, and force per input hiPSC-CM in 1MM and 0.5MM cardiopatches; n = 36/35 patches (1/0.5MM) from 13 differentiations; *p = 0.047, **p = 0.0021, ***p < 0.0001, unpaired t-test. h Conduction velocity (CV) and action potential duration at 80% repolarization (APD80) of 1MM and 0.5MM cardiopatches; n = 42/44 patches (1/0.5MM) from 10 differentiations; **p = 0.0028, unpaired t-test. Data in b, d, and e presented as mean ± SEM, while dot plots in g and h show all data points along with mean value (black line)

