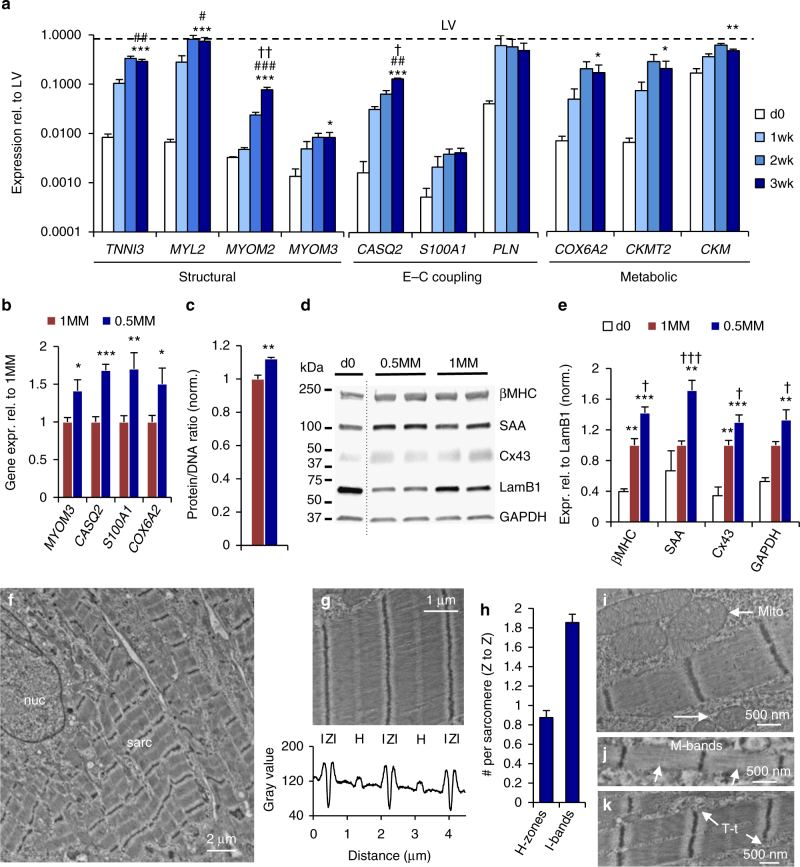
Fig. 4.
Increased cell maturation and size in low-density cardiopatches. a Relative expression levels of 10 maturation genes in d0, 1 week, 2 week, and 3 week cardiopatches compared with those in adult human left ventricles (LV). Linear regression from d0 to 3 weeks: TNNI3, MYL2, MYOM2, CASQ2, p < 0.0001; MYOM3, CKMT2, p < 0.014; S100A1, COX6A2, CKM, p < 0.006; PLN, p = 0.1081. *p < 0.05, **p < 0.001, ***p < 0.0001 vs. d0; # p < 0.023, ## p < 0.0006, ### p < 0.0001 vs. 1 week; † p < 0.037, †† p < 0.0037 vs. 2 week, via post hoc Tukey’s tests. For clarity, only 3-week statistical comparisons are shown. b Relative gene expression in 0.5MM vs. 1MM cardiopatches; *p < 0.041, **p < 0.0073, ***p < 0.0001, post hoc Tukey’s tests. c Protein/DNA ratio in 0.5MM vs. 1MM cardiopatches; n = 3/4 patches (1/0.5MM). d Representative western blots for myosin heavy chain-β (βMHC), SAA, lamin B1 (LamB1), GAPDH, and Cx43 in d0 cells and 3-week 0.5MM and 1MM cardiopatches; dotted line indicates lanes spliced from the same gel. e Quantified protein levels in d0 cells, 1MM and 0.5MM cardiopatches normalized to nuclear envelope protein LamB1, shown relative to 1MM cardiopatches; **p < 0.01, ***p < 0.001 vs. d0; † p < 0.05, †† p < 0.01, ††† p < 0.001 vs. 1MM, post hoc Tukey’s tests. For gene expression studies (a, b), n = 6 patches from two differentiations; for protein studies (c–e), n = 8/10 patches (1/0.5MM) from three to four differentiations. f Representative low-magnification view of cell nucleus (nuc) and surrounding sacromeric structures (sarc) in 3-week-old 0.5MM cardiopatches. Scale bar 2 µm. g Localization of I-bands, Z-discs, and H-zones within hiPSC-CM sarcomeres. Scale bar 1 µm. h Average number of H-zones and I-bands per sarcomere; n = 4 patches from two differentiations, data compiled from a total of 74 random fields of view. i Mitochondria (mito) were found positioned alongside CM myofibrils. Scale bar 500 nm. j, k Evidence of M-bands (j) and T-tubular-like structures (T-t, k) in 3-week-old 0.5MM cardiopatches. Scale bars 500 nm. All data are presented as mean ± SEM

