Fig. 5.
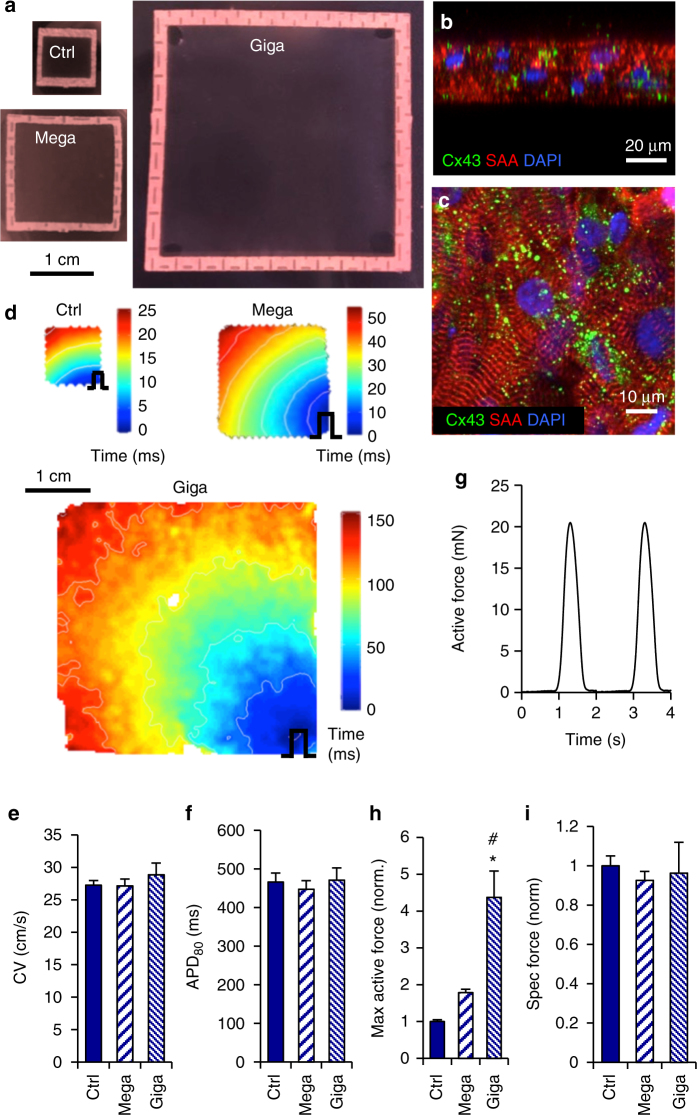
Scale-up of cardiopatches without loss of function. a Representative images of control (ctrl, 7 × 7 mm), Mega (15 × 15 mm) and Giga (36 × 36 mm) cardiopatches at 3 weeks of culture. Scale bar 1 cm. b, c Representative confocal images of 3-week-old Giga cardiopatches stained for Cx43 and SAA, as seen in confocal cross-sections (b) or in the XY plane in the middle of the patch (c). Scale bars 20 µm (b), 10 µm (c). d Representative activation maps of ctrl, Mega, and Giga cardiopatches following point stimulation from bottom right corner (pulse sign). Giga patches were imaged by an EMCCD camera. Scale bar 1 cm. e Conduction velocity (CV) in 3-week-old ctrl, Mega and Giga cardiopatches; n = 11/6/7 patches (ctrl/Mega/Giga) from three to four differentiations; p = 0.56, one-way ANOVA. f Action potential duration at 80% repolarization (APD80) in 3-week-old ctrl, Mega and Giga cardiopatches; n = 11/6/5 patches (ctrl/Mega/Giga) from three to four differentiations; p = 0.52, one-way ANOVA. g Representative isometric force trace from spontaneously contracting 3-week-old Giga cardiopatch at 16% stretch. h, i Maximum active forces (h) and specific forces (i) in 3-week-old ctrl, Mega, and Giga cardiopatches shown relative to Ctrl cardiopatch; n = 10/6/10 patches (ctrl/Mega/Giga) from three to four differentiations; *p < 0.0001 vs. ctrl, # p < 0.01 vs. Mega, post hoc Tukey’s tests; (i) p = 0.76, one-way ANOVA. Data are presented as mean ± SEM

