Fig. 6.
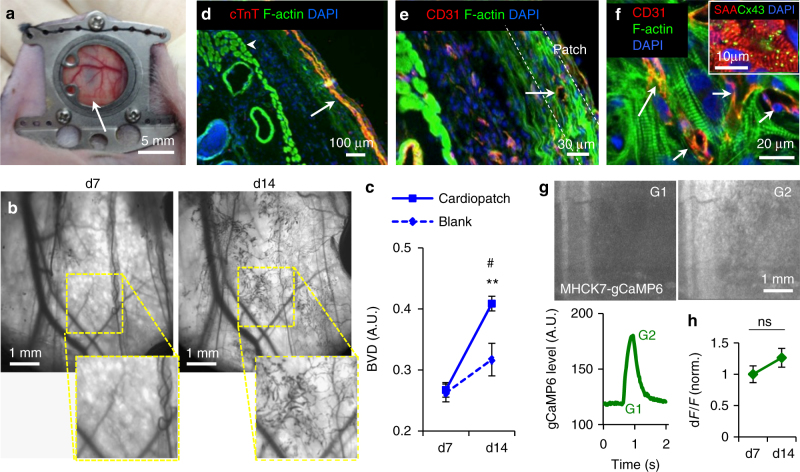
In vivo vascularization of cardiopatches. a Representative photograph of an implanted 3-week-old cardiopatch (arrow) in a dorsal skinfold window chamber of a nude mouse. b, c Intravital raw vascularization images (b) and quantification of blood vessel density (BVD, c) of cardiopatches on d7 and d14 post implantation relative to blank (Cerex® frame-only) controls; n = 18 mice (15 cardiopatches from 3 differentiations, 3 blank controls); repeated measures ANOVA: time F-ratio 34.8 (p < 0.0001), patch×time interaction effect F-ratio 6.81 (p < 0.02); for cardiopatch at d14: **p < 0.0001 vs. cardiopatch at d7, # p < 0.027 vs. blank at d14, post hoc Tukey’s tests. d, e Representative cross-sections of explanted cardiopatches after 2 weeks in vivo stained for F-actin, cTnT (d, arrow showing the cardiopatch) and CD31 (e, arrow showing a capillary lumen). f Representative en face image of cardiopatch explanted 2 weeks post implantation stained for F-actin and CD31 (arrows pointing to vessel lumens), and SAA and Cx43 (inset). g Representative fluorescence images and time trace of gCaMP6 signal during cardiopatch spontaneous activity 1 week after implantation; f, cardiopatch frame. h Ca2+ transient amplitude assessed as relative gCaMP6 fluorescence (dF/F) in cardiopatches at d7 and d14 following implantation; n = 12 patches from two differentiations; p = 0.2, paired t-test. Data are presented as mean ± SEM. Scale bars a 5 mm; b 1 mm; d 100 µm; e 30 µm; f 20 µm (inset 10 µm); g 1 mm

