Fig. 7.
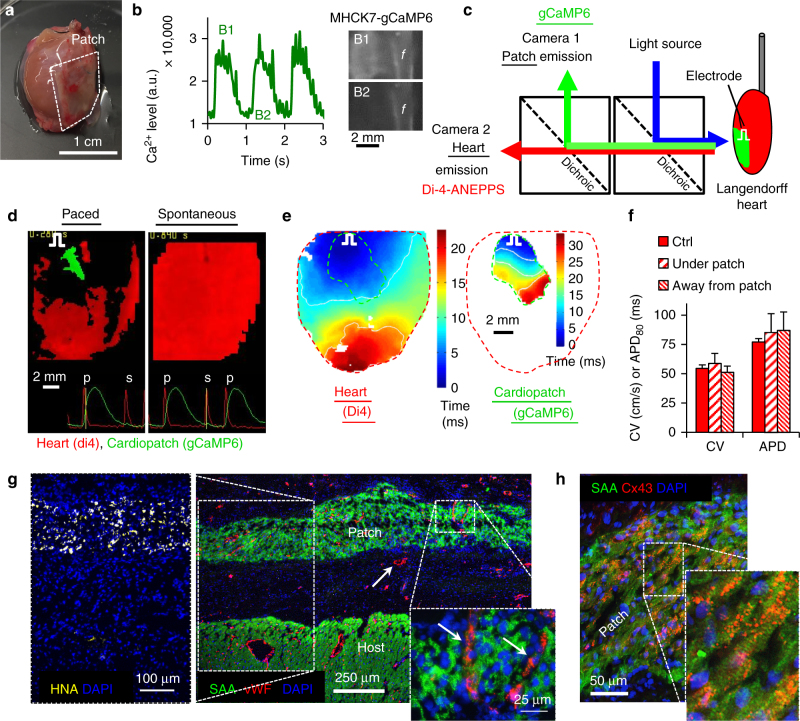
Epicardial implantation and ex vivo assessment of cardiopatches. a Representative image of cardiopatch 3 weeks following implantation onto nude rat epicardium; f, cardiopatch frame. b MHCK7-gCaMP6 flashes in implanted cardiopatches following direct stimulation by a platinum electrode; f, cardiopatch frame. c Schematic of a setup for dual optical mapping of gCaMP6-reported Ca2+ transients in implanted cardiopatches and Di-4-ANEPPS-reported transmembrane voltage in Langendorff-perfused rat hearts. d Representative snapshots from movies of Ca2+ transients in cardiopatches (green) and membrane voltage in the heart (red). Traces at the bottom show representative gCaMP6 (green) and Di-4 (red) signals from a single recording channel with yellow line denoting point in time corresponding to the instant of the movie snapshot. Pulse sign denotes location of stimulus electrode;p, paced; s, spontaneous. e Representative isochronal maps of action potential propagation during direct point electrode stimulation (pulse sign) of implanted cardiopatch (black dashed outline) and underlying rat myocardium (red dashed outline). f CV and APD of host epicardium optically recorded in control conditions (no patch), under implanted cardiopatch (under patch), and remote from implanted cardiopatch (away from patch); n = 6/3/3 (control/under/away). g, h Representative cross-sections of cardiopatch 3 weeks after implantation onto rat epicardium stained for SAA, von Willebrand Factor (vWF), and human nuclear antigen (HNA, h) and SAA and Cx43 (h). Data are presented as mean ± SEM. Scale bars a 1 cm; B1–2 2 mm; d, e 2 mm; g main: 250 µm, left inset: 100 µm, right inset: 25 µm; h 50 µm

