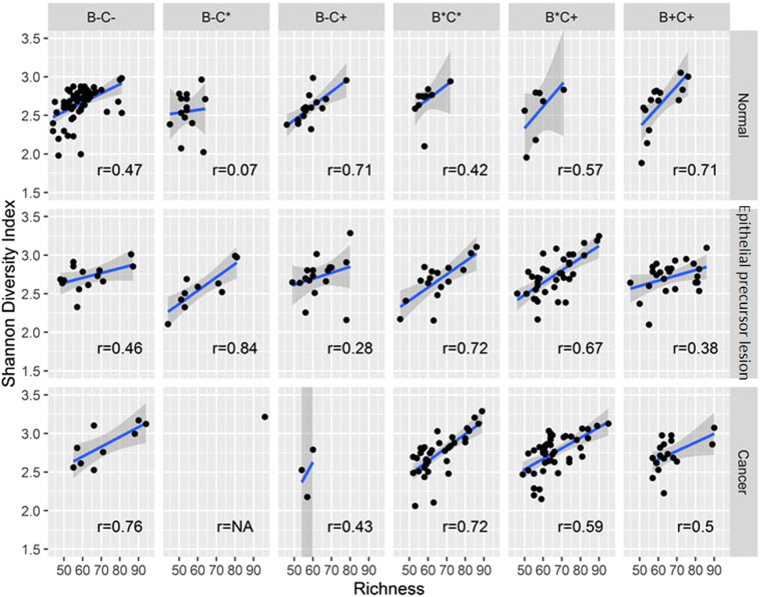
Figure 1.
Correlations between species richness and Shannon diversity index within subgroups. In the B+C+ subgroup, the coefficient is as high as 0.7 for the Normal group, whereas it declines to 0.37 and 0.48 for patients with epithelial precursor lesions and OSCC, respectively. The B−C+ subgroup shows a similar pattern. In the B* C* subgroup, the coefficients are 0.42 for the Normal group and 0.7 for the other subgroups. In the B−C* subgroup, the correlation between species richness and the Shannon diversity index for the Normal group is very weak.

