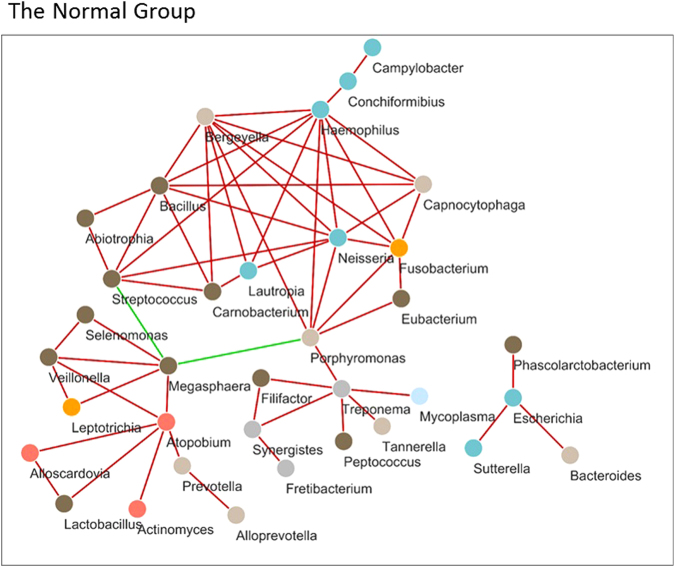
Figure 4.
Network analysis of salivary microbiota using SparCC correlation coefficients (Normal group). The figure shows networks between abundant sequences at the genus level built from SparCC correlation coefficients. The nodes represent genera of bacteria; the edges represent the correlation coefficients between genera. The edges are coloured green for negative correlations and red for positive correlations. Nodes of networks are shown when their correlation coefficients are in the top 60 absolute values of the correlation coefficients. In this figure, the number of nodes is 35, and the range of the absoulte values of the correlation coefficients is from 0.339 to 0.622. Nodes are coloured according to their phylum.

