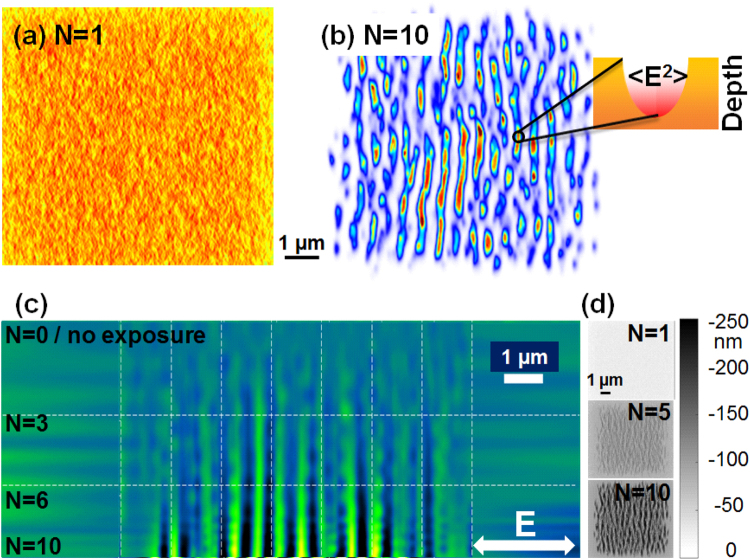
Figure 5.
Electromagnetic field computations. (a) Simulated energy deposition pattern on Zr-BMG after exposure to a single fs laser pulse on a rough surface. A surface model is used where roughness is estimated via a distribution of 15 nm size nanoparticles and 50% filling factor. (b) Simulated energy deposition pattern on Zr-BMG after exposure to N = 10 laser pulses. We observe the onset of a clear regular pattern with a periodicity below the wavelength. The insert indicates preferential light trapping and localization at surface depressions. (c) Evolution on a sectional topography profile (line section of the surface relief) with the number of pulses. (d) Typical computed 2D surface topography profiles for an increasing sequence of incoming pulses.

