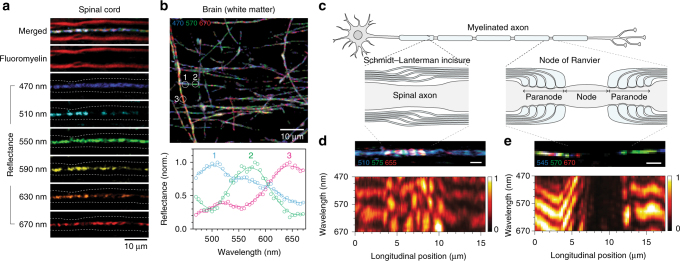
Fig. 3.
SpeRe on nervous tissues. a SpeRe images of the mouse spinal cord with fluorescent counterstaining of the myelin (fluoromyelin). Dashed lines in reflectance images indicate axon−myelin interfaces. Note that the reflectance signal is localized at the centerline. b A representative SpeRe image of the mouse brain near the corpus callosum (470 nm for blue, 570 nm for green, 670 nm for red) and representative reflectance spectra at the labeled axon segments. c A schematic illustration of the myelinated axon in a spinal neuron. d A reflectance image and spectral map at Schmidt–Lanterman incisure. Scale bar, 2 μm. e A reflectance image and spectral map at the node of Ranvier. Scale bar, 2 μm

