Fig. 4.
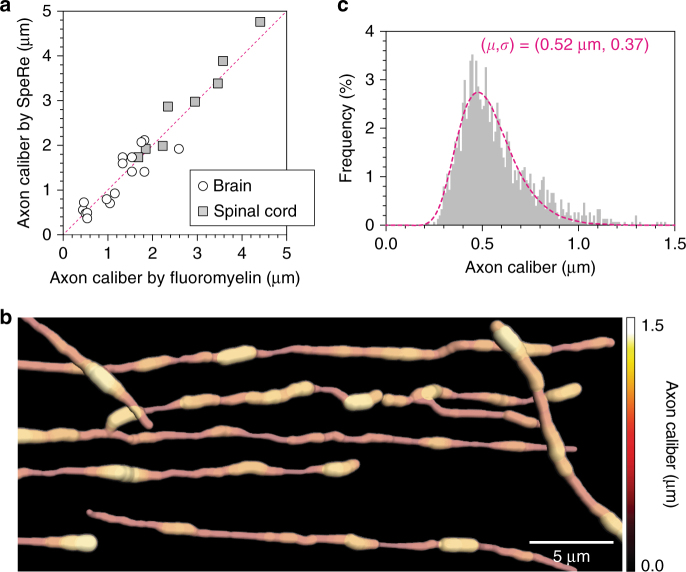
Nanoscale mapping of axon caliber. a Validation of axon caliber, as measured by SpeRe. Diameters of axons from the brain (n = 16) and the spinal cord (n = 8) were quantified using both SpeRe and a fluoromyelin-based method. The red dotted line indicates the unity line (R 2 = 0.93). b A nanoscale volumetric view of the axon. The image stack (xyzλ) is skeletonized and rendered using the axon diameter extracted from wavenumber period for each pixel on the skeleton. Myelin is not shown. c Probability density function of axon diameter acquired from b. The diameter is quantified for each 1.2 μm axon segment. The dotted line indicates the best fit to log-normal distribution (geometric mean = 0.52 μm, geometric standard deviation = 0.37)

