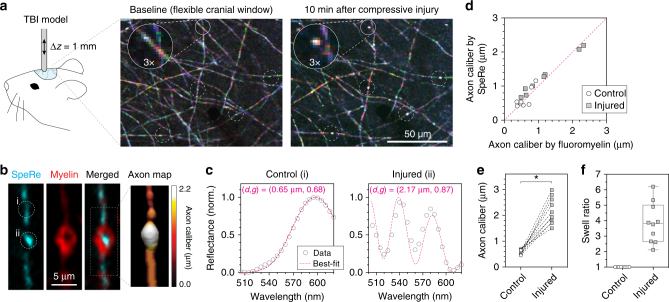
Fig. 6.
In vivo imaging of nanoscale axonal pathology in traumatic brain injury. a SpeRe images of the live mouse cortex (layer I) before and after mild compressive injury (1 mm indentation for 30 s). White circles indicate injured axon segments. b An injured axon from a cortical tissue slice imaged ex vivo using reflectance (cyan) and flouromyelin fluorescence (red). The axon map was reconstructed using the axon diameters obtained by fitting the measured spectrum for each segment to simulation data. c Reflectance spectra of the nearby control and injured axon segments, which are indicated as ‘i’ and ‘ii’, respectively, in b. Dotted lines in magenta are simulation curves that provide the best fit to experimental spectra (caliber = 0.65 μm, g-ratio = 0.68 for control; caliber = 2.17 μm, g-ratio = 0.87 for injured). d Validation of axon caliber measurement by SpeRe in injured axons. Dotted line in magenta is a unity line (R 2 = 0.94, n = 10 axons). e Quantification of axon diameter in nearby control and injured axon segments. f Swell ratio in the bulged axon quantified by dividing the axon diameter in the bulging region by the axon diameter in the nearby control segment. *p < 0.0001 (paired t-test, two-sided)

