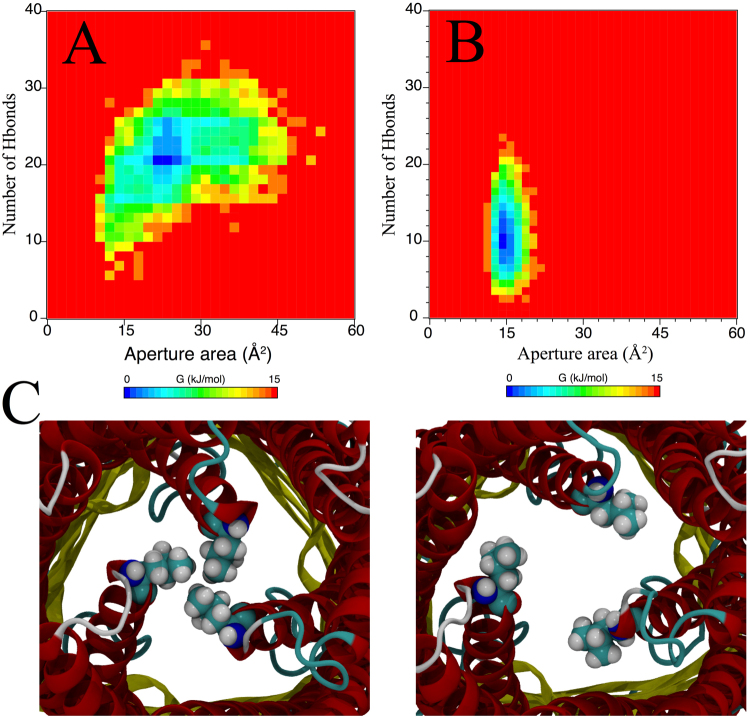
Figure 6.
Energy profiles for the opening of the OprM periplasmic aperture. (A) Computed energy profile as a function of the number of hydrogen bonds and the aperture area of OprM. This profile featured the aperture opening as triggered by the interaction with MexA. (B) Idem as (A), however the profile was obtained from the interaction between OprM and the inner component MexB. (C) Snapshots featuring the structural mechanism of OprM aperture opening as obtained from (A).

