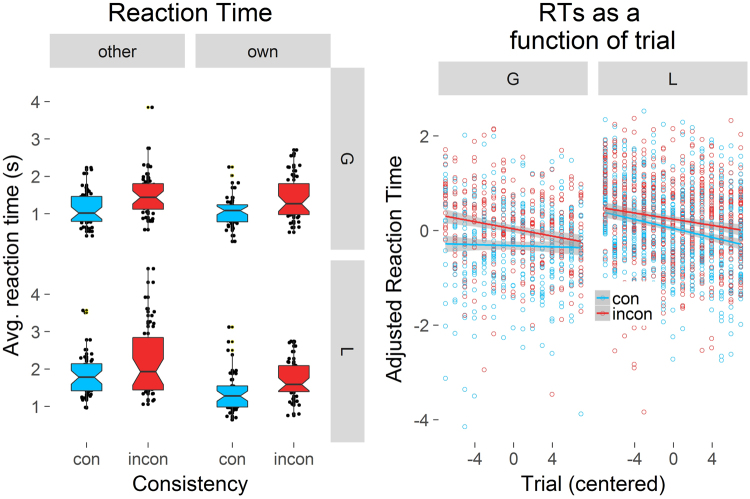
Figure 3.
The effects of Consistency (consistent = con in blue vs. inconsistent = incon in red), Object type (global = G vs. local = L) and Room type (other vs. own) on RTs (left). Lower values indicate better location memory performance. The central mark is the median of each boxplot. The notches indicate 95% confidence intervals for the medians. The right graph displays partial effects (thus “adjusted”). RT on the y-axis against centered trial count as a function of Object type (global = G vs. local = L) and Consistency (consistent = con vs. inconsistent = incon). Shaded areas represent 95% confidence intervals.

