Figure 3.
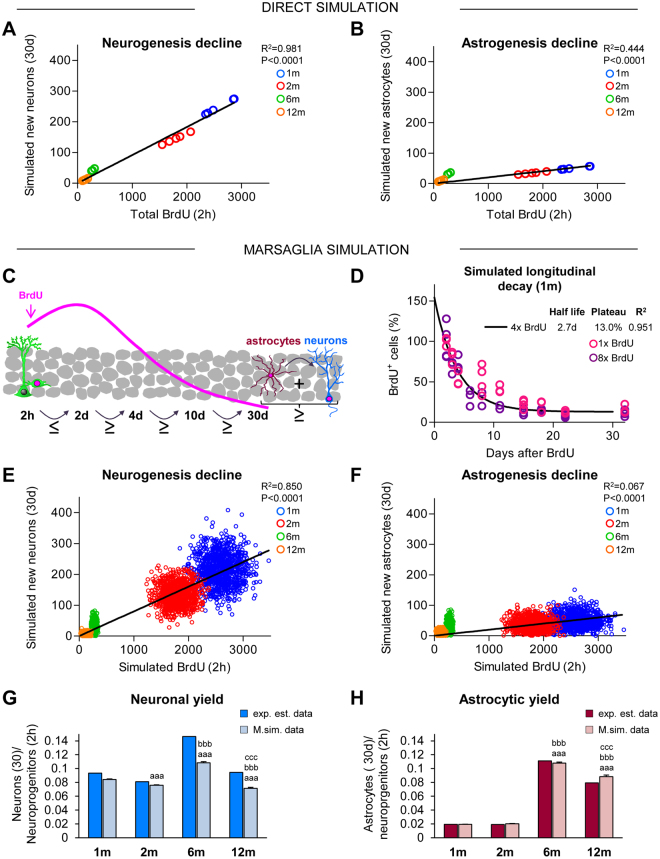
Neurogenesis but not astrogenesis decline is due to the disappearance of proliferating neuroprogenitors. (A,B) Linear regression of the number of newborn neurons (A) and astrocytes (B) at 30d generated from proliferating progenitors at 2 h across adulthood. Estimated number of BrdU+ cells at 2 h (Fig. 1C) were correlated with the simulated number of BrdU+ NeuN+ or BrdU+ GFAP+ cells at 30d, calculated from the estimated survival and differentiation rates (Figs 1D and 2E, respectively). Each dot represents an individual value. The linear regression curve, R2, and p-value are shown (further data is shown in Table S8). N per group as in Fig. 2F. (C) Cartoon representing the Marsaglia simulation model restrictions based on Figs 1 and 2. In the model, the number of simulated BrdU+ cells at 2d must be equal or larger than at 2 h. After 2d, each time point should have the same or fewer BrdU+ cells. At the end of the 30d period, the sum of newborn astrocytes and neurons should be equal or smaller than the total BrdU+ cells at 30d. A comparison between the experimentally estimated and the Marsaglia simulated data is shown in Table S6. (D) Longitudinal decay of 1 m simulated BrdU+ cells over the time course (2d–30d), calculated as an exponential curve with plateau. Fitting curve, cell half-life, survival plateau (%), and R2 are indicated (further data is shown in Table S7). Individual dots represent two independent sets of BrdU data from single (1x BrdU) and cumulative (8x BrdU) injection paradigms25. N = 3 for 2dp, 3dp, 4dp, 11dp, 18dp and 32dp and N = 4dp, 8dp, 15dp, 22dp in 1x BrdU; N = 3 for 6dp, 8dp, 11dp, 15dp, 22dp, and 32dp and N = 4 for 2dp, 4dp, 18dp for 8x BrdU. (E,F) Linear regression analysis of the simulated number of newborn neurons (E) and astrocytes (F) at 30d, generated from the proliferating progenitors at 2 h across adulthood using the Marsaglia polar simulation model. Pseudorandom simulated numbers of BrdU+ cells at 2 h and BrdU+ NeuN+ or BrdU+ GFAP+ cells at 30d were obtained using the mean and standard deviation values (Figs 1C,D and 2E, Table S6). 1,000 pseudorandom cells per age group for each population were generated. Each dot represents an individual value. The linear regression curve, R2, and p-value are shown (further data is shown in Table S8). (G,H) Neuronal (G) and astrocytic (H) yield of proliferating neuroprecursors derived from the experimentally estimated and the Marsaglia simulated data. Kruskal-Wallis analysis was H(3) = 425.9, p < 0.001 for neuronal yield, and H(3) = 2367, p < 0.001 for astrocitic yield. a, b, and c represent significance compared to 1 m, 2 m, and 6 m, respectively (p < 0.05) for Marsaglia simulated data. Two symbols are used to represent p < 0.01 and three for p < 0.001. Bars represent mean ± SEM. Further data is shown in Table S11.

