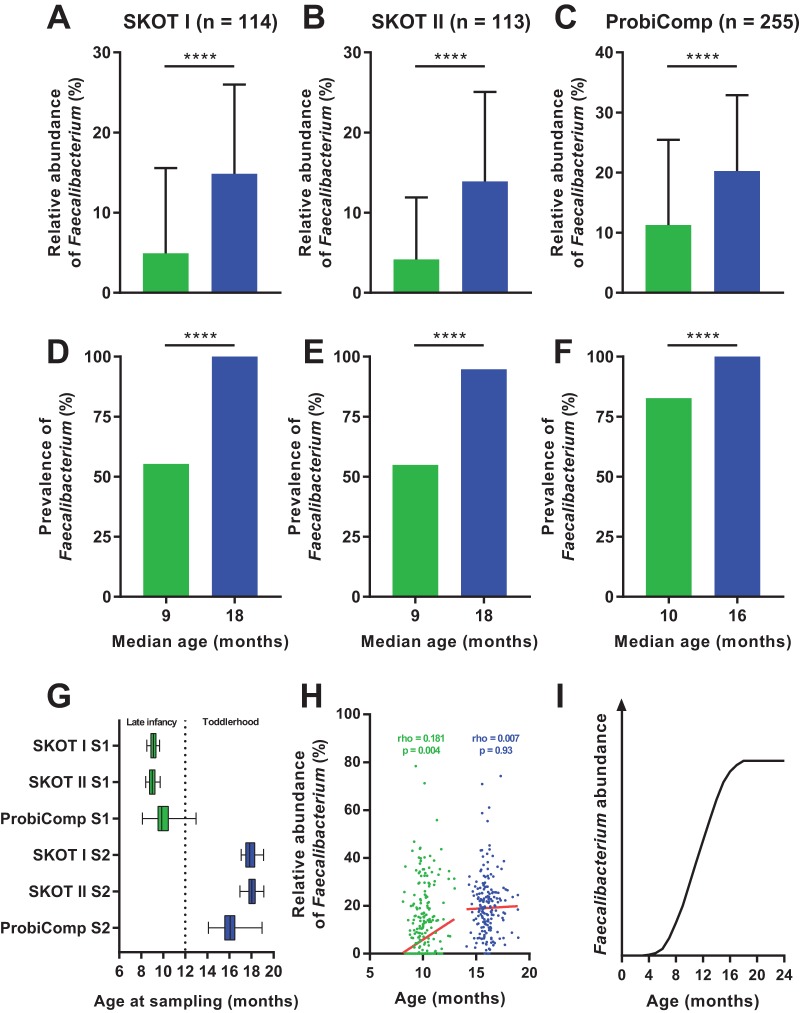
FIG 1 .
Colonization dynamics of Faecalibacterium prausnitzii. (A to C) Mean relative abundance of Faecalibacterium in SKOT I, SKOT II, and ProbiComp during late infancy (8 to 12 months old) (green) and toddlerhood (14 to 19 months old) (blue). Values are means plus standard deviations (SD) (error bars). Mean values that are significantly different (P < 0.0001) by Mann-Whitney test are indicated by a bar and four asterisks. (D to F) Prevalence of Faecalibacterium in SKOT I, SKOT II, and ProbiComp during late infancy (green) and toddlerhood (blue). Mean values that are significantly different (P < 0.0001) by Fisher exact test are indicated by a bar and four asterisks. (G) Variation in age at the two sampling points (sampling point 1 [S1], late infancy; S2, toddlerhood) for SKOT I, SKOT II, and ProbiComp. Boxes indicate 25th to 75th percentiles, with median values marked as a line and whiskers indicating minimum and maximum values. The dotted line indicates the age that distinguishes late infancy from toddlerhood. (H) Spearman’s rank correlations of age versus relative abundance of Faecalibacterium during late infancy (green) and toddlerhood (blue) in ProbiComp. Red lines indicate robust nonlinear regression fit to the data points. (I) Proposed colonization dynamics of Faecalibacterium as a function of age based on data from this study and previous studies (13–15).

