FIG 1.
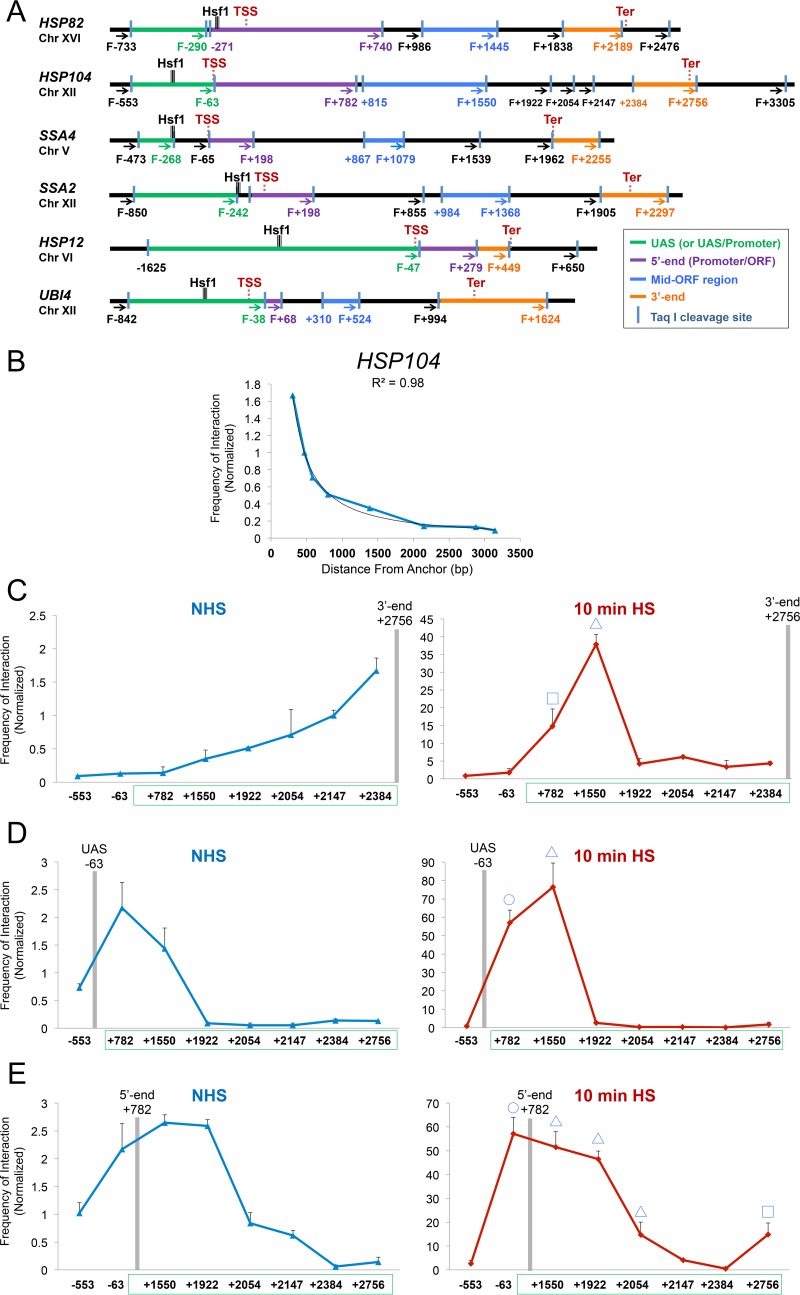
TaqI-3C reveals heat shock-dependent interactions between regulatory and coding regions. (A) Physical maps of HSP genes evaluated in this study. Coordinates correspond to TaqI sites; numbering is relative to the ATG codon (+1). Primers used for 3C analysis were sense strand identical (forward [F]) and positioned proximal to TaqI sites as indicated (arrows). UAS, 5′-end, mid-ORF, and 3′-end TaqI fragments are color-coded as indicated. Also indicated are locations of transcription start sites (TSS) and termination sites (Ter) (65, 66). Sites of Hsf1 occupancy were determined by ChIP sequencing (unpublished data). (B) Chromosomal contacts detected by TaqI-3C at a representative HSP gene exponentially decay with distance under noninducing conditions. The plot depicts frequency of contacts detected in cross-linked chromatin isolated from NHS cells sequentially digested with TaqI and ligated with T4 DNA ligase as described in Materials and Methods. The +2756 primer (3′ end) of HSP104 was used as an anchor. A regression curve (power function) to fit the data is also shown. Data are derived from two independent biological replicates (n = 2; qPCR = 4 for each primer combination). (C) Nonspecific contacts detected by TaqI-3C are strongly overridden by heat shock. Plots depict normalized interaction frequencies between the 3′-end anchor and the indicated loci within HSP104 in NHS and 10-min HS cells (cross-linking performed at 30°C and 39°C, respectively, as is the case throughout). Note the difference in scale. Green box, HSP104 transcribed region. A square signifies 5′-3′ gene looping, and a triangle signifies gene crumpling. Shown are means and standard deviations (SD); n = 2; qPCR = 4. (D) Analysis performed as described for panel C, except that the plots depict interaction frequencies between the UAS anchor and the indicated loci within HSP104. A circle signifies UAS-promoter looping; other symbols are as described for panel C. (E) Analysis as described for panel D, except the HSP104 5′ end served as an anchor. Here and for previous panels, a BY4742 background strain was used.

