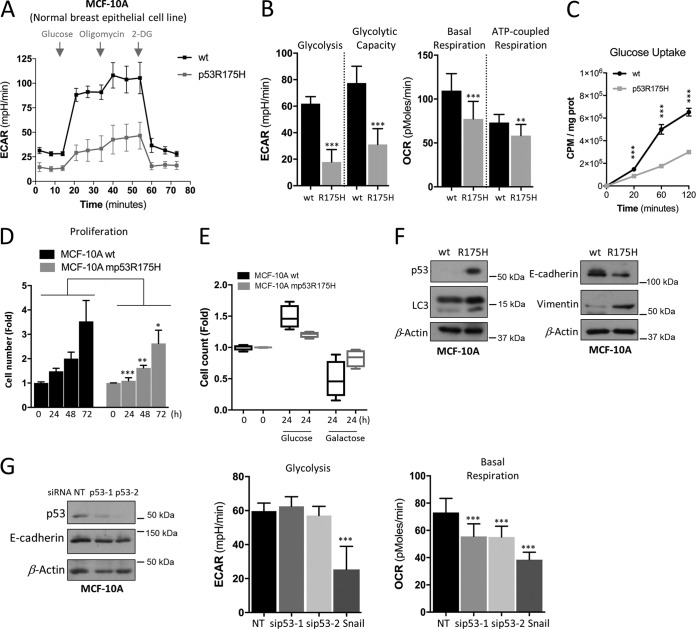
FIG 4.
p53R175H mutant in nontumorigenic MCF-10A cells suppresses both glycolysis and mitochondrial metabolism. (A and B) Seahorse measurements of ECAR and OCR in parental (wt) and stable mutant p53 (p53R175H) expressing normal breast epithelial cell line MCF-10A cells. (C) Glucose uptake in parental (wt p53) and mutant p53R175H MCF-10A cells. (D) Cell expansion assay performed over 3 days to analyze proliferation in wt and stably expressing mutant p53R175H MCF-10A cells. (E) The effect of galactose on cell expansion in wt and stably expressing mutant p53R175H MCF-10A cells compared to glucose. (F) Western blots showing p53 expression, E-cadherin and vimentin (EMT markers), and LC-3 (autophagy marker). β-Actin was used as a loading control. (G) Western blots showing the NT (nontargeting) and p53 siRNA knockdown efficiency of p53 and E-cadherin expression in wt MCF-10A cells and measurements of ECAR and OCR following siRNA-mediated knockdown compared to that of NT or stably expressing Snail MCF-10A cells. ECAR values of glycolysis and maximal glycolytic capacity, as well as of basal versus maximal respiration and of ATP generated per consumed oxygen, are presented. Data are expressed as means ± SD (n = 3). Statistical significance is shown above the level for the control. *, P < 0.05; **, P < 0.001; ***, P < 0.0001; two-tailed Student's t test.

