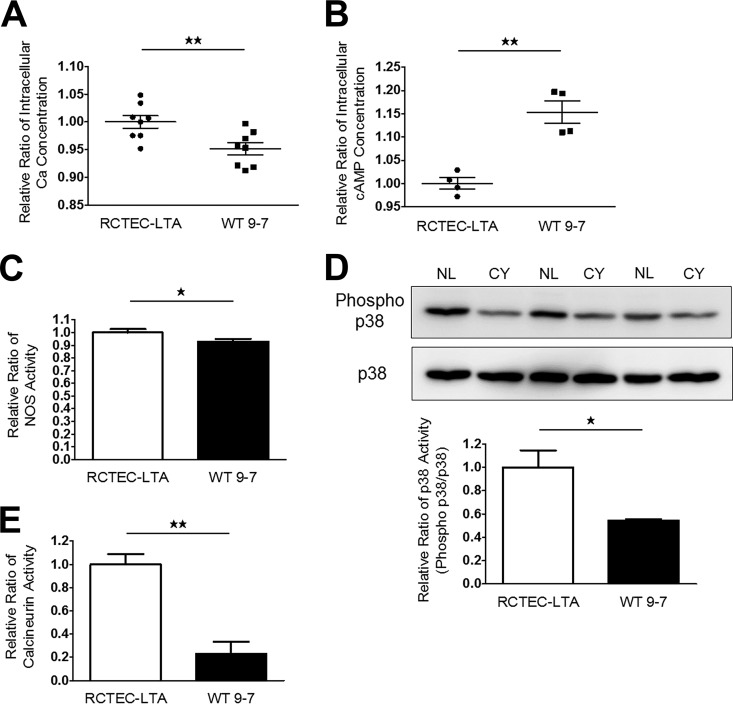
FIG 11.
PGC-1α regulatory mechanisms in cyst-derived cells. (A and B) Intracellular Ca2+ (each group, n = 8) (A) and cAMP concentrations (each group, n = 4) (B) of normal tubular cells (RCTEC-LTA) and cyst-derived cells (WT 9-7). Results represent the relative ratio. (C and D) NOS (C) and p38 MAPK (D) activities of RCTEC-LTA and WT 9-7 (each group, n = 3). Results represent the relative ratio. The bar graph shows the relative ratio of p38 activity (phosphor-p38/p38). (E) Calcineurin activities of RCTEC-LTA and WT 9-7 (each group, n = 3). Results represent the relative ratio. All results represent the means ± standard deviations. *, P < 0.05; **, P < 0.01.

