FIG 12.
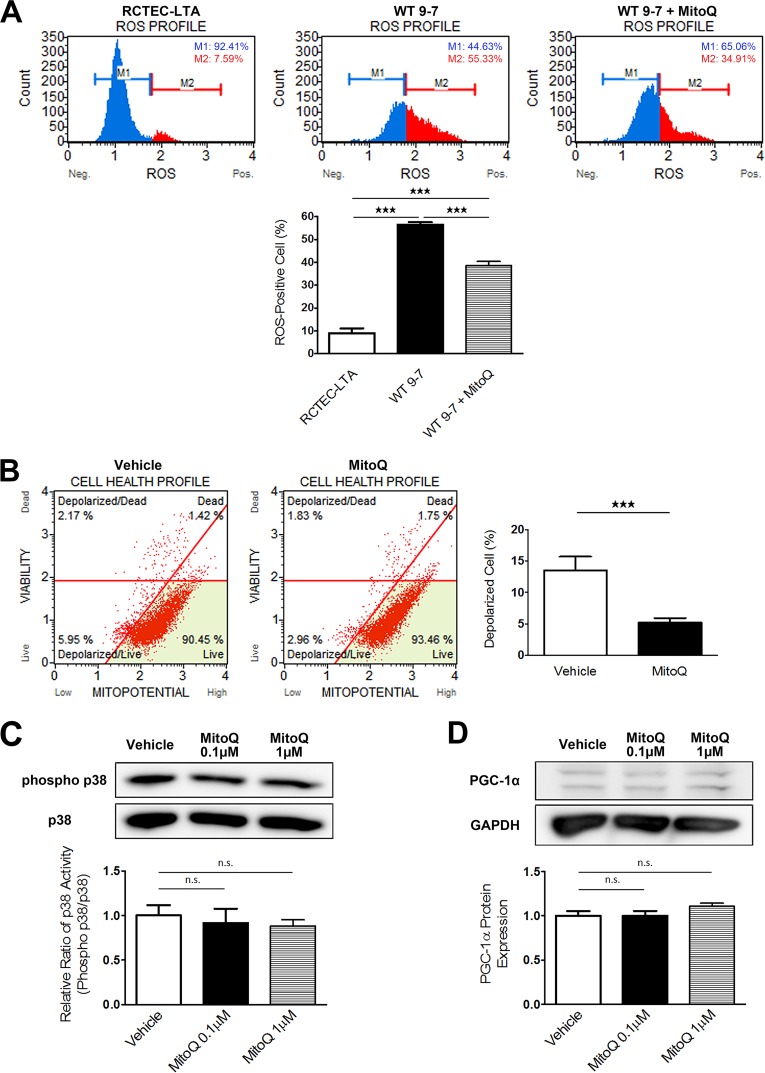
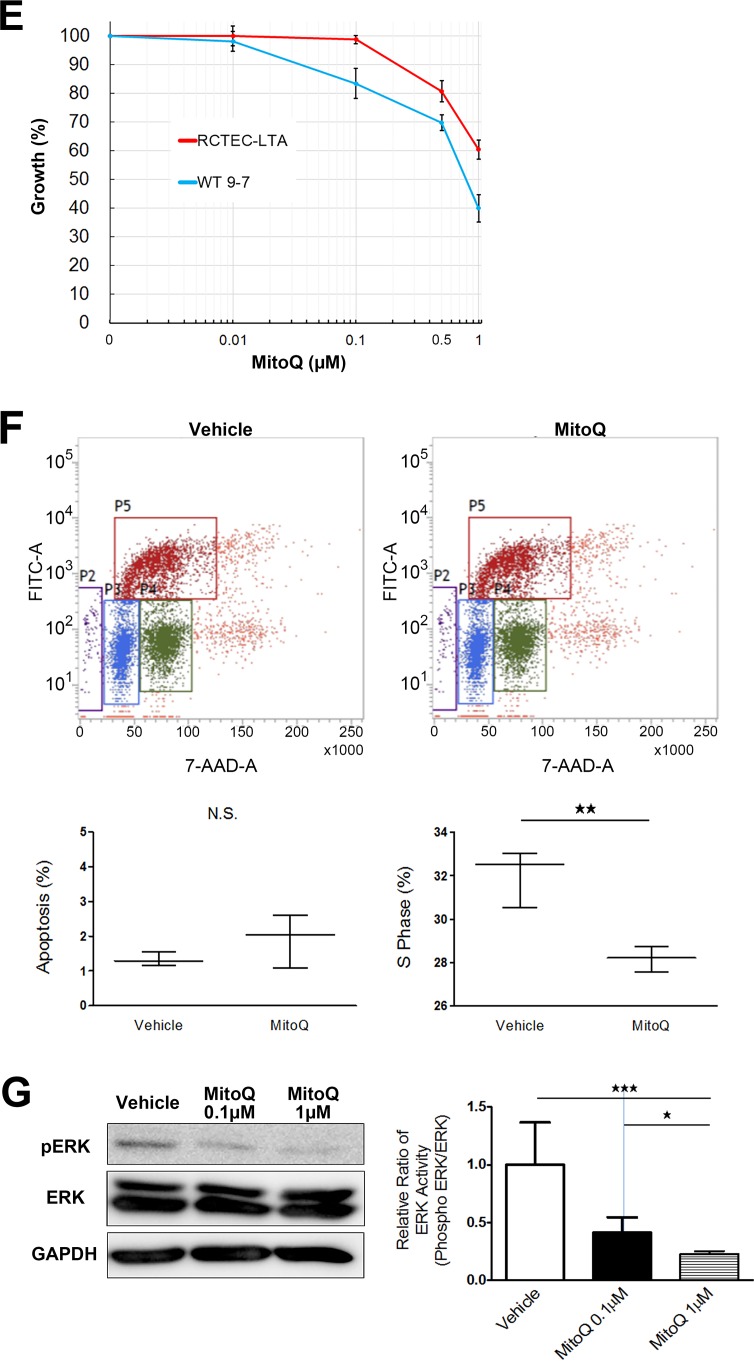
Amelioration of mitochondrial abnormality in cyst-derived cells by mitochondrion-targeted therapy (MitoQ). (A) Evaluation of intracellular ROS (superoxide) to assess intracellular superoxide levels following mitochondrion-targeted therapy using MitoQ. The x and y axes represent cell number and ROS signaling strength, respectively, with ROS-negative cells (M1) and ROS-positive cells (M2) identified. The ROS-positive cell number in cyst-derived cells (WT 9-7) are compared with that in control cells (RCTEC-LTA) and MitoQ-treated (1.0 μM for 48 h) cyst-derived cells (Cyst + MitoQ). The bar graph shows the percentage of ROS-positive cells (each group, n = 3). (B) Evaluation of mitochondrial membrane potential. The bar graph shows the percentage of depolarized cells (each group, n = 3). Depolarization of inner mitochondrial membrane potential in cyst-derived cells treated with MitoQ (1.0 μM for 48 h) (MitoQ) compared with cyst-derived cells treated with vehicle (Vehicle) is shown. (C) p38 MAPK activities in WT 9-7 treated with MitoQ (each group, n = 3). Results represent the relative ratio. The bar graph shows the relative ratio of p38 activity (phosphor-p38/p38). (D) PGC-1α expression in WT 9-7 treated with MitoQ (each group, n = 3). Results represent the relative ratio. The bar graph shows the relative ratio of PGC-1α expression. (E) Effect of MitoQ treatment (48 h) on cell proliferation of RCTEC-LTA and WT 9-7 (each group, n = 3). (F) Results of BrdU flow cytometry regarding the percentages of apoptotic and S-phase cells in control and MitoQ-treated groups (each group, n = 3). (G) Western blot analysis of ERK showing effects of MitoQ treatment on ERK activity (each group, n = 3). Results represent the means ± standard deviations. *, P < 0.05; **, P < 0.01; ***, P < 0.001. n.s., not significant.


