FIG 2.
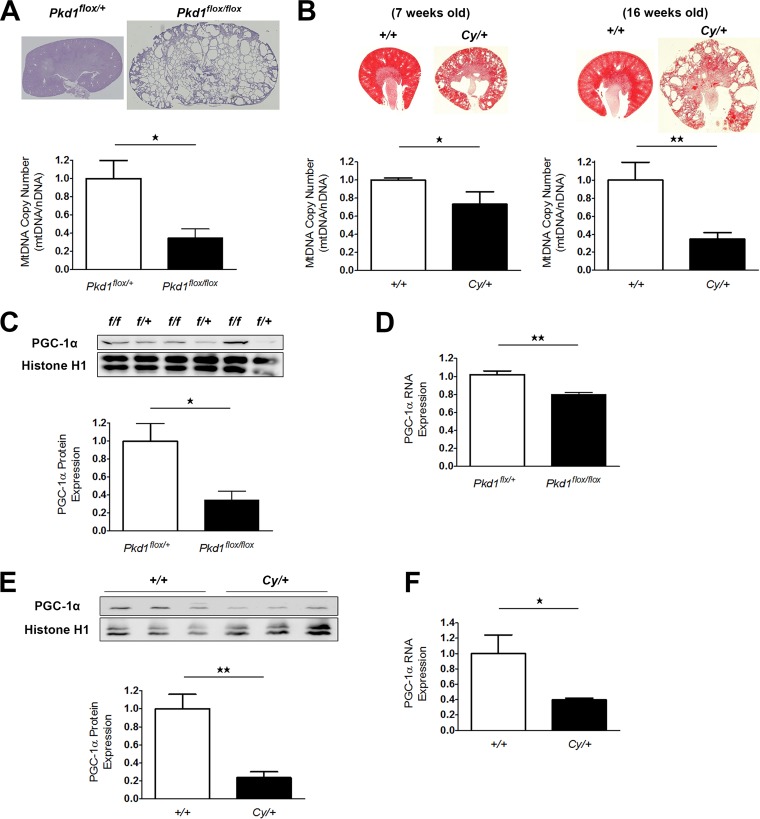
mtDNA copy number and PGC-1α expression in the kidneys of animal models of ADPKD. (A) Relative ratio of mtDNA copy number (mtDNA/nDNA) in kidney tissue from 7-day-old Ksp-Cre PKD1flox/flox mice and controls (Ksp-Cre PKD1flox/+ mice). Top, representative kidney tissue of PAS staining. Bottom, Bar graph showing the relative ratio of mtDNA copy number (each group, n = 3). (B) Left, relative ratio of mtDNA copy number in kidney tissue from 7-week-old Cy/+ rats and 7-week-old wild-type rats (+/+). Upper left, representative kidney tissue after hematoxylin-eosin (HE) staining. Lower left, bar graph showing the relative ratio of mtDNA copy number (each group, n = 3). Right, relative ratio of mtDNA copy number in kidney tissue from 16-week-old Cy/+ rats and 16-week-old wild-type rats (+/+). Upper right, representative kidney tissue after HE staining. Lower right, bar graph showing the relative ratio of mtDNA copy number (each group, n = 3). (C) Representative Western blot analysis of PGC-1α in the kidneys of 7-day-old Ksp-Cre PKD1flox/flox mice and controls (Ksp-Cre PKD1flox/+ mice). The bar graph shows the relative ratio of protein expression calibrated by histone H1 in control kidney tissue (each group, n = 3). (D) Representative real-time PCR analysis of mRNA for PGC-1α in the kidneys of 7-day-old Ksp-Cre PKD1flox/flox mice and controls (each group, n = 3). (E) Representative Western blot analysis of PGC-1α in the kidneys of 7-week-old Cy/+ rats and wild-type rats (+/+). (F) Representative real-time PCR analysis of mRNA for PGC-1α in the kidneys of 7-week-old Cy/+ rats and wild-type rats (+/+) (each group, n = 3). The bar graph shows the relative ratio of protein expression calibrated by histone H1 in control kidney tissue. *, P < 0.05; **, P < 0.01.

