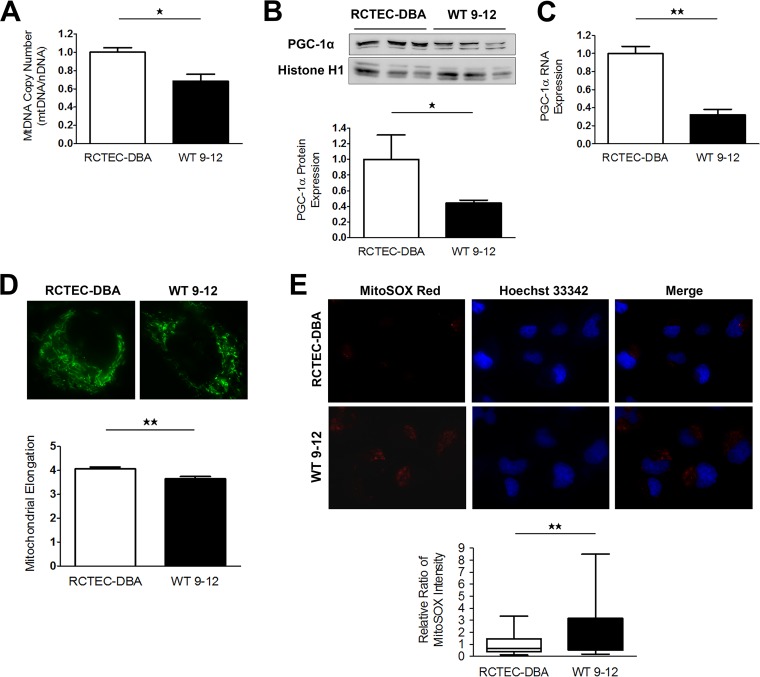
FIG 4.
Mitochondrial abnormalities in human ADPKD cyst-derived cells with a homozygous PKD1 mutation. (A) mtDNA copy number in cyst-derived cells containing a homozygous PKD1 mutation (WT 9-12) compared to a normal tubular cell line (RCTEC-DBA) (each group, n = 3). Results represent the relative ratio. (B) Western blot analysis of PGC-1α levels in WT 9-12 and RCTEC-DBA (each group, n = 3). The bar graph shows the relative ratio of protein expression calibrated by histone H1 in normal and cyst-derived cells. (C) mRNA expression of PGC-1α in WT 9-12 and RCTEC-DBA (each group, n = 3). The bar graph shows the relative ratio of mRNA expression calibrated by GAPDH in normal and cyst-derived cells. (D) MitoTracker Red FM staining of WT 9-12 and RCTEC-DBA. Mitochondrial elongation was evaluated using ImageJ software, and units represent the ratio of major axis to minor axis (each group, n = 30). (E) Evaluation of mitochondrial superoxide in WT 9-12 compared to RCTEC-DBA by MitoSOX Red staining (each group, n = 25). The box plot shows the signal intensity. Results represent the means ± standard deviations. *, P < 0.05; **, P < 0.01.

