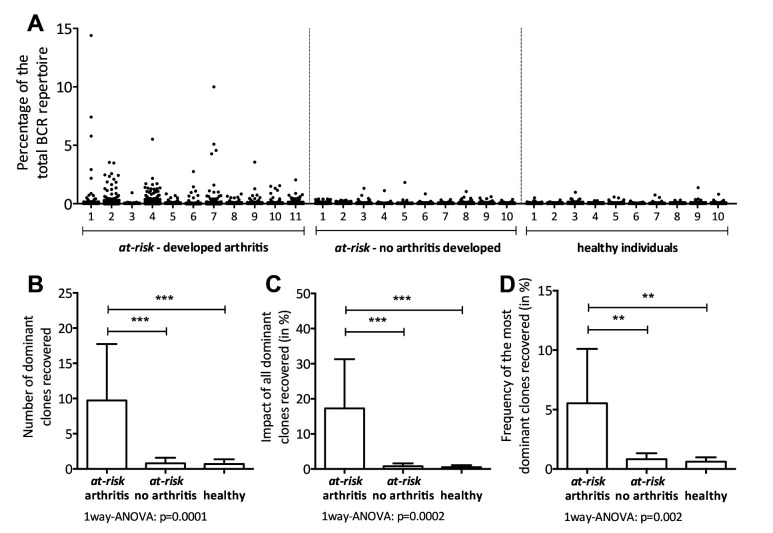
Figure 1.
(A) Scatterplot of the BCR repertoire in peripheral blood of 11 at-risk individuals who developed arthritis (at-risk - developed arthritis), 10 at-risk individuals who did not develop arthritis (at-risk - no arthritis developed) and 10 autoantibody negative healthy individuals. Each dot represents one clone. The size of the clones is depicted as percentage of the total BCRheavy sequences. (B) The absolute number of dominant BCR clones (clonal size ≥0.5% of the total repertoire), (C) the impact of all dominant clones combined and (D) the size of the single most dominant clone, in at-risk individuals who developed arthritis (at-risk arthritis, n=11) versus at-risk individuals who did not develop arthritis yet (at-risk no arthritis, n=10), and healthy individuals (healthy, n=10). Bars show mean and SD, ***p<0.0001, **p<0.001 using one-way ANOVA. ANOVA, analysis of variance; BCR, B-cell receptor.

