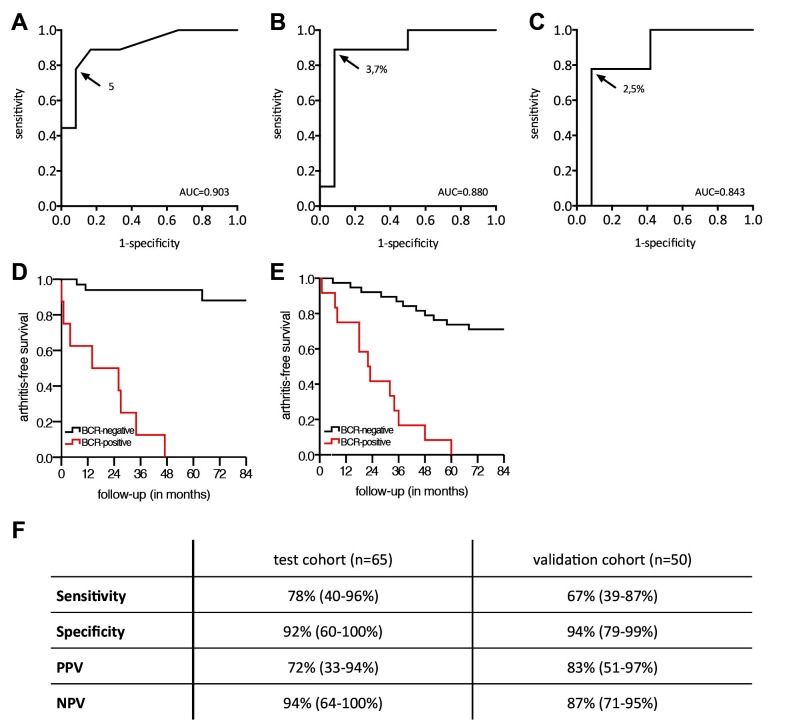
Figure 2.
Receiver operating characteristic curves for (A) the number of dominant clones, (B) the impact of all dominant clones combined and (C) the impact of the most dominant clone in at-risk individuals (n=21). The development of arthritis was analysed after 36 months of follow-up. The arrow points to the cut-off value chosen, and the corresponding value is shown. (D) Kaplan-Meier curve for BCR-clone positive and BCR-clone negative individuals in the test cohort, assuming the at-risk individuals analysed represent a random selection of the total at-risk individuals (n=65). (E) Kaplan-Meier curve for BCR-clone positive and BCR-clone negative individuals in the validation cohort. (F) Table describing sensitivity, specificity, PPV and NPV including 95% CIs for the BCR-clone model, in the test cohort and the validation cohort. AUC, area under the curve; BCR, B-cell receptor; NPV, negative predictive value; PPV, positive predictive value.

