Figure 1.
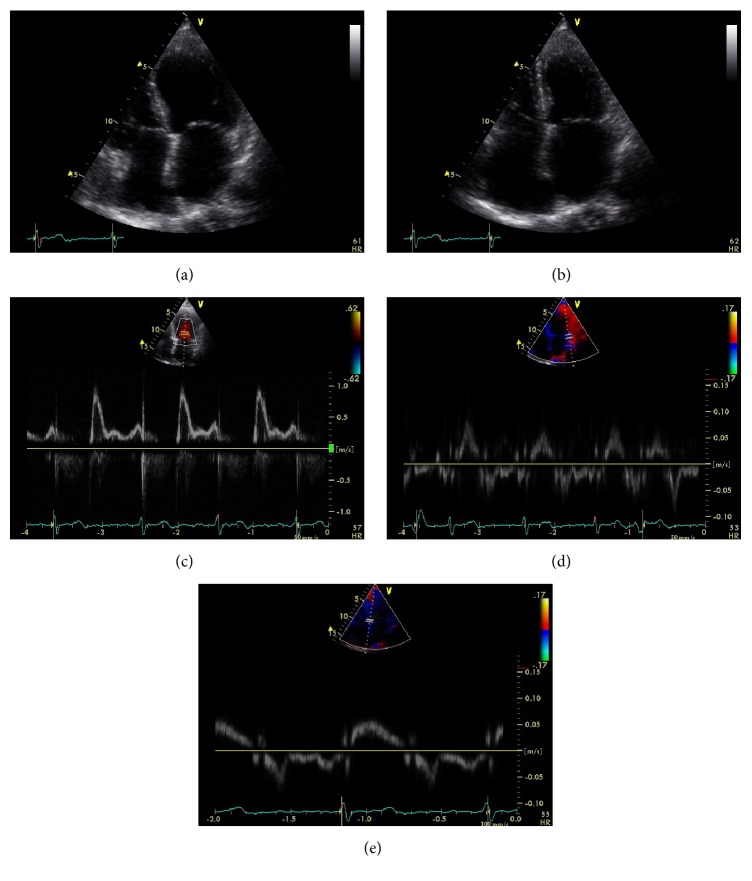
Echocardiographic images from a patient with restrictive cardiomyopathy. Two-dimensional 4-chamber view in diastole (a) and systole (b), showing normal left ventricular volume, wall thickness, and systolic function (EF 62%). There is marked biatrial enlargement. Pulse wave Doppler from the left ventricular inflow (c) showing restrictive filling pattern with an E wave velocity of 1 m/sec, an A wave velocity of 0.4 m/sec, and an E wave deceleration time of 145 msec. Spectral tissue Doppler from the lateral (d) and septal (e) mitral annulus. There is marked reduction in systolic annular velocities indicative of latent systolic dysfunction. E/e′ (e′ measured as the average between the two annular e′ velocities) is 16, indicative of increased left ventricular filling pressure. Note the marked reduction in lateral a′ velocity (<4 cm/sec) indicative of left atrial systolic dysfunction.

