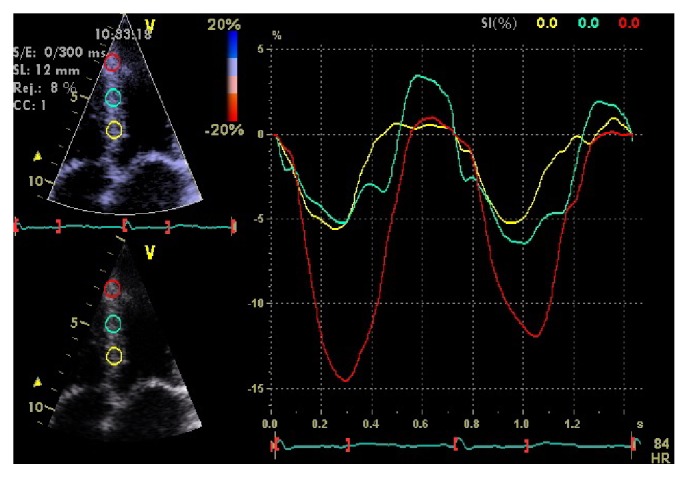
Figure 4.

Strain curves from the interventricular septum of the same patient appearing in Figures 2 and 3. In this example, strain curves were constructed with the Doppler Myocardial Imaging technique. There is reduced peak systolic strain of the basal (yellow curve) and mid (green curve) septal segments, compared to the apical segment (red curve) with an apex to base ratio > 2.1.
