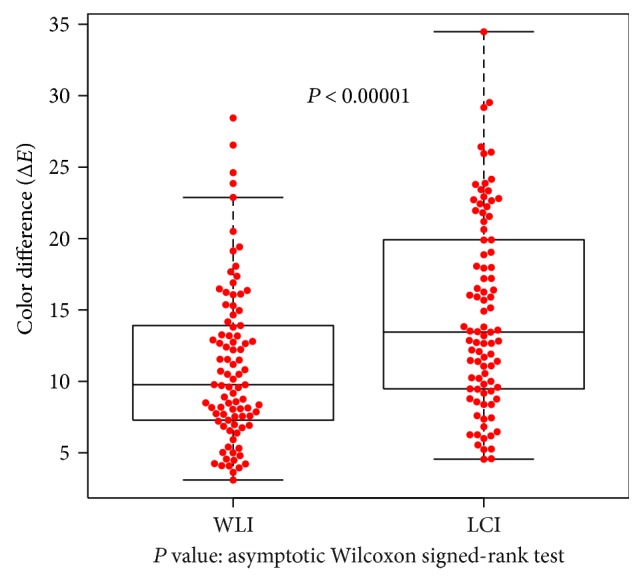
Figure 4.

Color differences at the atrophic border examined by WLI and LCI in the overall cohort. Differences were computed between sample areas of the atrophic and nonatrophic mucosae. In 30 patients who provided consent, color differences expressed as ΔE and evaluated at 90 points were compared between WLI and LCI. ΔE values were significantly higher for LCI (P < 0.00001 by asymptotic Wilcoxon signed-rank test).
