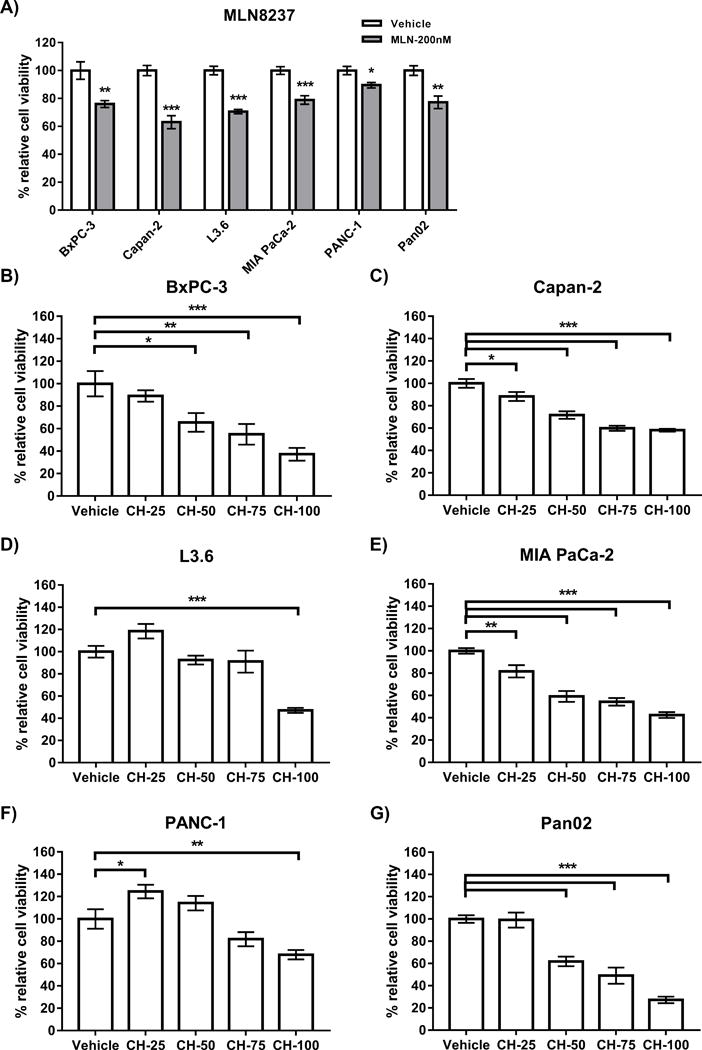
Figure 1. MLN8237 and Chaetocin (CH) demonstrate a dose-dependent inhibition of PDAC cell growth.

A) PDAC cell lines (5E4 per well of 96 well) were plated and treated with MLN8237 for 72hrs at a dose of 200nM. Treatment of B) BxPC-3, C) Capan-2, D) L3.6, E) MIA PaCa-2, F) PANC-1 and G) Pan02 PDAC cell lines (5E4 per well of 96 well) with escalating doses of chaetocin (25nM, 50nM, 75nM and 100nM) for 48hrs, demonstrated a dose-dependent inhibition of cell growth. Cell viability was measured by MTS, normalized to a vehicle control and data (technical triplicate with biological n=3) are represented as mean±SEM. For MLN8237, treated cells were compared to control by Student’s t-test. For Chaetocin treated cell lines, statistical significance was calculated by 1-way ANOVA with multiple comparisons. * indicates p-value ≤0.05, ** indicates p-value ≤0.005, *** indicates p-value ≤0.0005
