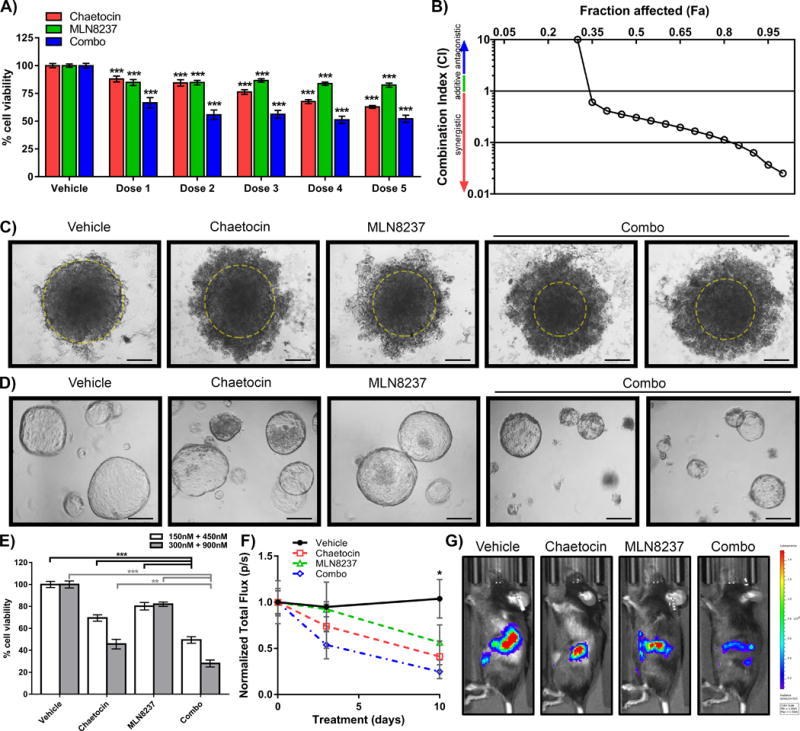
Figure 3. Combination treatment of 3D spheroids, organoids and orthotopic xenografts increases efficacy of PDAC growth reduction.

A) PANC-1 cells were grown in methylcellulose as spheroids to mimic a 3D tumor model and treated with various concentrations of vehicle, chaetocin or MLN8237 alone and in combination (Dose 1: 50nM chaetocin, 150nM MLN8237; Dose 2: 150nM chaetocin, 450nM MLN8237; Dose 3: 300nM chaetocin, 900nM MLN8237; Dose 4: 450nM chaetocin, 1350nM MLN8237; Dose 5: 600nM chaetocin, 1800nM MLN8237). APH activity was measured by colorimetric readings and mean cell viability (mean±SEM, n=3) calculated as a percentage of vehicle-treated control. Each experiment was performed in triplicate and statistical significance compared to control was calculated by 1 way ANOVA with multiple comparisons, *** indicates p-value ≤0.0005. B) The CI for the spheroid model indicated that the drugs act synergistically. C) Representative images after 72hrs of treatment are presented. Yellow circle delineates edge of relatively dense core of the spheroid. Scale=25μm. D) Pancreatic duct cells were isolated from the pancreas of Ela-Kras mice and grown in matrigel domes to form 3D organoids. Representative images after 72hrs of treatment (300nM CH, 900nM MLN, and 300nM CH +900nM MLN8237) are presented. Scale=25μm. E) After 72hrs of treatment with vehicle, chaetocin (150nM, 300nM), MLN8237 (450nM, 900nM) and combination (150nM+450nM or 300nM+900nM, CH+MLN8237 respectively), Ela-Kras organoid viability was assessed by luminescent readings normalized to the vehicle-treated organoids. Each experiment was performed in triplicate, results expressed as mean ± SEM, and statistical analyses were performed using 1-way ANOVA and multiple comparisons. ** indicates p-value ≤0.005, *** indicates p-value ≤0.0005. F) C57Bl/6 mice were orthotopically injected with syngeneic Pan02 cells constitutively expressing luciferase and allowed to recover and grow tumors for 1 week before initiating vehicle, chaetocin or MLN9237 alone and combination treatments. To monitor in vivo tumor growth, mice were injected with D-luciferin at 0, 3, and 10 days of treatment and total flux (photons/second, p/s) measured for each mouse in the Xenogen IVIS-200 imaging system. Total flux was normalized to day 0 and averaged (mean±SEM) across mice per condition and statistical significance was calculated by multiple t-tests at each day using the Holm-Sidak correction for multiple comparisons. * indicates p- value ≤0.05 for comparison of combination treatment to vehicle control. Treatments with individual drugs did not produce statistically significant effects. G) Representative images of mice injected with D-luciferin at day 10.
