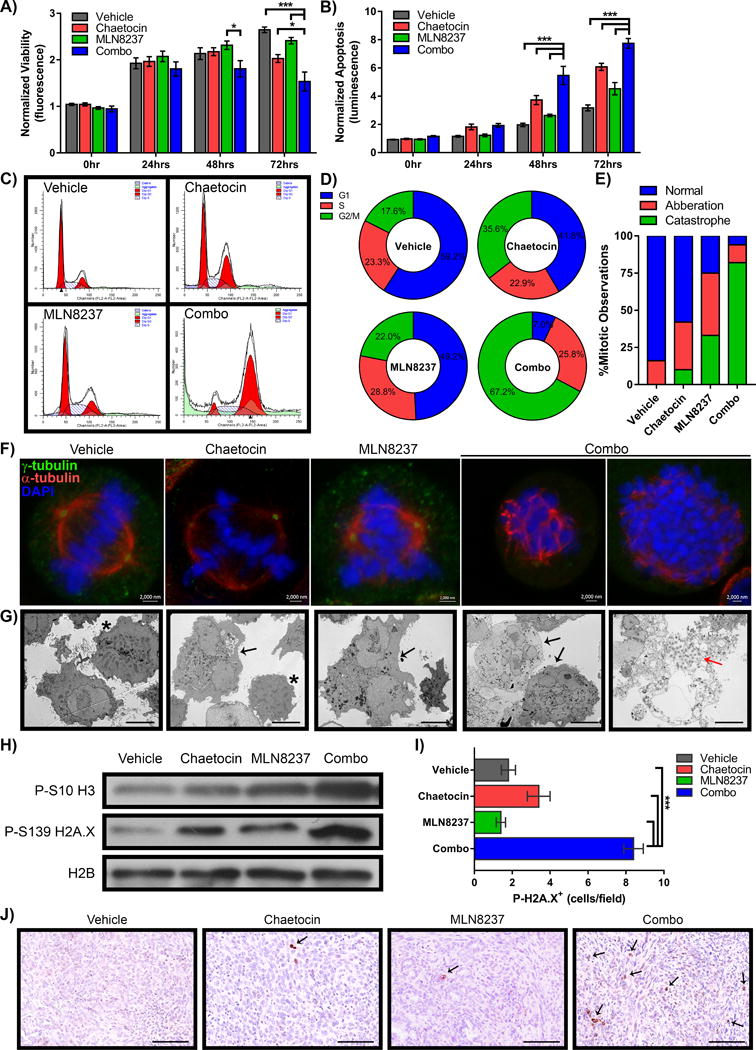
Figure 4. Chaetocin–MLN8237 combination synergizes to trigger a G2/M shift and significant mitotic catastrophe.

PANC-1 cells were plated and treated for 0, 24, 48 and 72hrs with vehicle, chaetocin (30nM), MLN8237 (90nM) or combination (30 + 90nM, CH + MLN8237 respectively). Levels of cell A) viability and B) apoptosis were observed by protease and caspase 3/7 cleavage of fluorescent and luminescent substrates respectively. Values were normalized to 0hr vehicle for each treatment and statistical significance calculated by 2-way ANOVA with Tukey’s multiple comparisons test. * indicates p- value ≤0.05, *** indicates p-value ≤0.0005. C) FACS analysis of PANC-1 cells treated for 48hrs with chaetocin, MLN8237 and combination treatments resulted in slightly increased G2/M arrest for single treatments and nearly complete G2/M arrest and cell death (sub G1 events shown in light green) for the combination treatment. Representative FACS cell cycle graphs illustrate the significant shift and D) average percentage (n=2) of events in each phase of cell cycle, G1, S, or G2/M are graphed with relative percentages indicated in each segment. E) L3.6 cells were treated with vehicle, chaetocin, MLN8237 or combination for 48hrs, fixed and stained antibodies to γ-tubulin (green), α-tubulin (red), and DNA stained with DAPI (blue) to consider mitotic progression. Over 150 mitotic cells were observed and quantified as normal, aberration, or catastrophe and resultant graph indicates the percentage of the total number of cells counted. F) Representative images of cells counted as normal mitosis (vehicle), multiple spindle poles (chaetocin and MLN8237 alone), and total disruption of the spindle apparatus in mitotic catastrophe during combination treatment. Scale=2000nm. G) EM images of PANC-1 cells after 72hrs of treatment demonstrated multinucleated cells (black arrows). Normal mitoses are indicated by (*). Evidence of mitotic cell death/mitotic catastrophe is shown in the combination treatment (red arrow). Scale=10μM. H) PANC-1 lysates after 48hrs of treatment indicate that the relative levels of P-S10 H3 and P-S139 H2A.X (indicators of mitotic catastrophe) are increased in the combination treatment by Western blot, with H2B as loading control. Pancreatic tissue from orthotopic xenografts was stained by IHC for P-S139 H2A.X as a measure of mitotic catastrophe in vivo. I) Quantification of average positive staining cells per field are graphed ±SEM with 5 field views per sample. Statistical significance was performed using a Student’s t-test to compare combination treatment to all other conditions, *** indicates p-value ≤0.0005. J) Representative fields illustrate the increased number of positively stained cells (black arrows) in the combination treated animals as compared to vehicle, chaetocin or MLN8237 alone. Scale=0.1mm.
