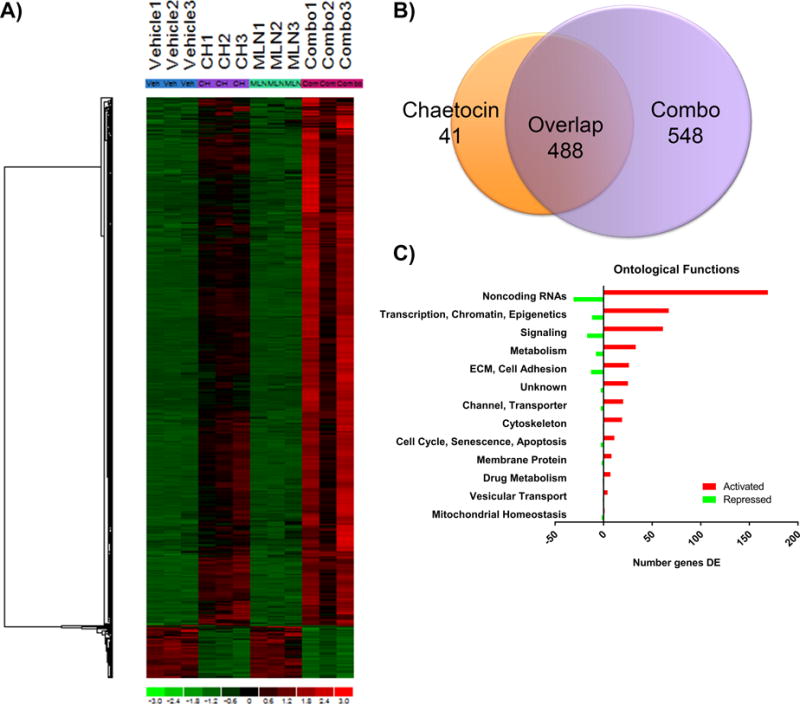
Figure 5. RNA-seq defines molecular markers of the MLN8237-chaetocin response.

RNA-seq was performed on PANC-1 cells that were treated for 24hrs with vehicle, chaetocin (30nM), MLN8237 (90nM) or combination (30 + 90nM, CH + MLN8237 respectively). A) Hierarchical clustering of all genes identified across the four conditions indicates large clusters of genes increased after cells were treated with the combination of drugs. B) A Venn diagram of the two conditions that induced differential gene expression, chaetocin alone and combination, illustrates 548 unique genes that changed expression only in the combination therapy. C) Separation of the 548 DEG by ontological function demonstrates that genes include a large number of non-coding RNAs and transcriptional, chromatin, epigenetic elements. Red and green bars depict up-regulated and down-regulated genes in each category, respectively.
