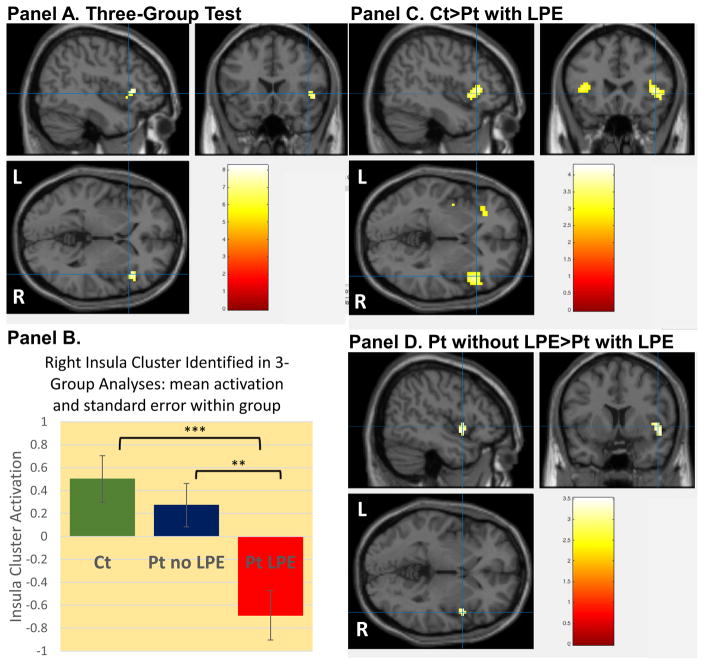
Figure 2.
Testing for group differences during decision (Active Trials minus Calculation Trials). Panel A. Whole-brain three-group test for activation differences demonstrating a cluster in right insula, inferior frontal gyrus and superior temporal gyrus. [Cluster is referred to as insula cluster in this figure and the manuscript results and discussion sections; crosshair x,y,z coordinates 44.6, 18.7 and 0.6, respectively]. Panel B. Cluster from three-group analyses was identified for each subject (using MarsBaR) and within group means and standard errors are presented. Three group ANOVA was significant (p<0.001) as expected. Two group comparisons demonstrated that patients with LPE differed significantly from (1) typically-developing controls (p<0.001) and (2) patients without LPE (p=0.005) using post-hoc Tukey s tests. Panel C. Whole-brain two-group analyses testing for differences typically-developing controls > patients with limited prosocial emotions (LPE), showing activation differences in the bilateral insula and inferior frontal gyrus (comparison of patients with LPE > typically-developing controls showed no significant differences; x,y,z coordinates 45, 23.4, −0.03, respectively). Panel D. Whole-brain two-group analyses testing for differences patients without LPE > patients with LPE showing activation differences in right insula and superior temporal gyrus (comparison of patients with LPE > patients without LPE showed no significant differences; x,y,z coordinates 48.6, 8.04, −0.70, respectively). Note: two-group comparisons of typically-developing controls and patients without LPE showed no significant differences. Detailed results of two-group analyses are available in Supplemental Table 2.

