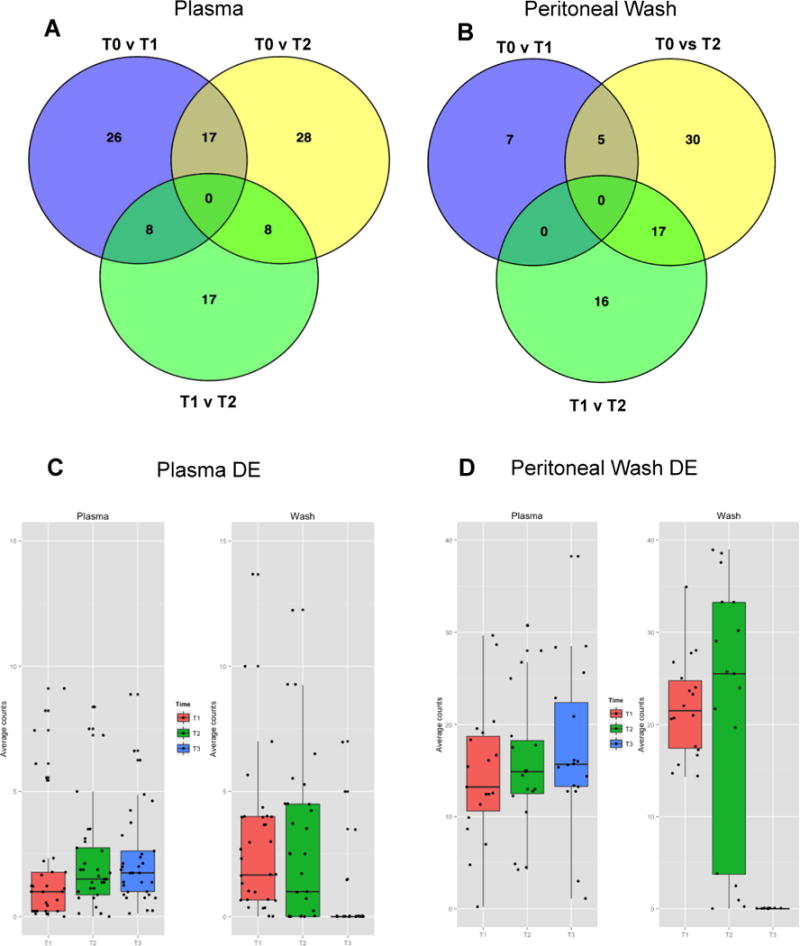
Figure 2.

Plasma from n=9 (A) and PW samples from n=3 (B) were used for miRNA extraction at three time points (T0, T1, and T2 as described in Fig. 1). Significantly differentially expressed (DE) miRNA (p<0.05) were identified using the edgeR Bioconductor statistics package. The Venn diagrams show numbers of DE miRNA for all three group comparisons (T0 vs T1, T1 vs T2, and T0 vs T2 respectively). Complete lists of the DE mRNA from plasma and PW amongst two group comparisons are included as Supplemental Figures 2 and 3. More miRNA were found to be DE in plasma samples were an earlier alteration than PW. The 22 differentially expressed miRNA from PW samples and the 33 DE miRNA from plasma (Supplemental Figures 3 and 4) are not only unique to their environment but also display different patterns of expression in the alternate environment. C. The DE PW miRNA undergo significant fluctuation in the wash environment but are relatively stable when they are viewed in the plasma. D. The DE plasma miRNA appear to be altered in the opposite direction when viewed in the wash environment. Individual box plots for the PW and plasma DE miRNA viewed in each environment are included as Supplemental Figures 5–8.
