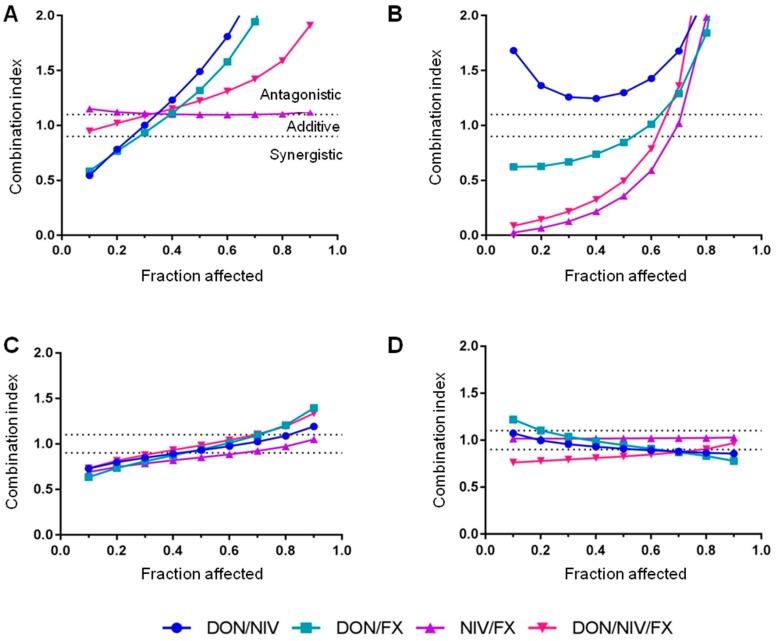
Figure 2.
Combination index (CI) versus cell fraction affected curves for binary and ternary mixtures of DON, NIV and FX on A549 (A), 16HBE14o- (B), hAECN (C) and hAECB (D) cells. CI < 0.9, CI = 0.9–1.1 and CI > 1.1 reveal synergistic, additive and antagonistic effects, respectively. Data are derived from three independent experiments performed in triplicate.

