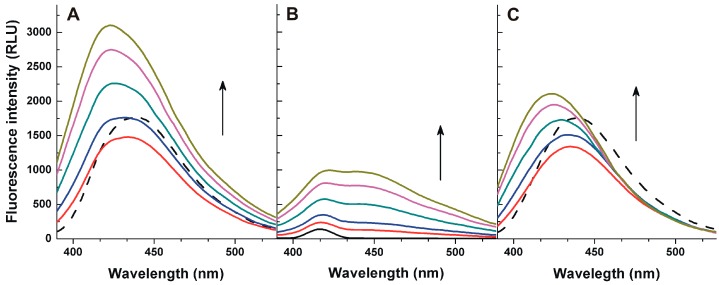
Figure 2.
Fluorescence emission spectra of 1 μM AFB1 in the absence (A, dotted line) and in the presence of increasing HSA concentrations (A, solid lines; 2.5, 5.0, 10, 15, and 20 μM). Fluorescence emission spectra of increasing HSA concentrations in the absence of AFB1 (B; 2.5, 5.0, 10, 15, and 20 μM). The subtraction of the spectra represented in (A) (IAFB1+HSA) and (B) (IHSA) is demonstrated in (C) (IAFB1+HAS–IHSA) (λexc = 365 nm; PBS, pH 7.4).

