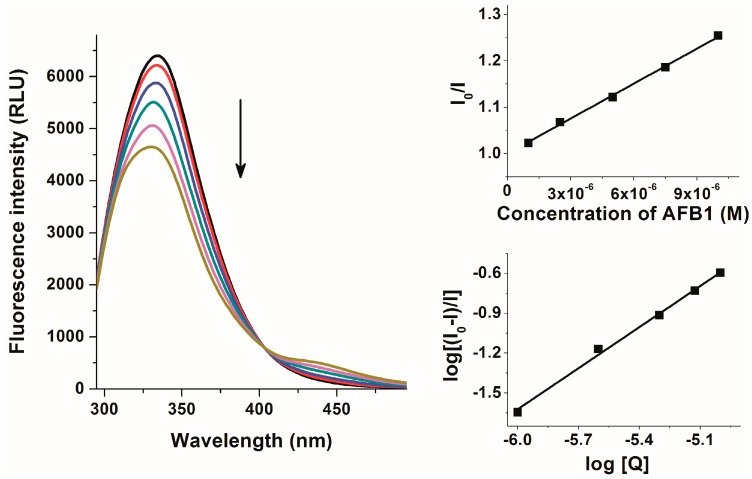
Figure 3.
Fluorescence emission spectra of 2 μM HSA in the absence and presence of increasing AFB1 concentrations (1.0, 2.5, 5.0, 7.5, and 10 μM) in PBS at pH 7.4 (left) as well as Stern-Volmer (top right) and double logarithmic Stern-Volmer (bottom right) plots of the interaction (λexc = 280 nm, λem = 334 nm).

