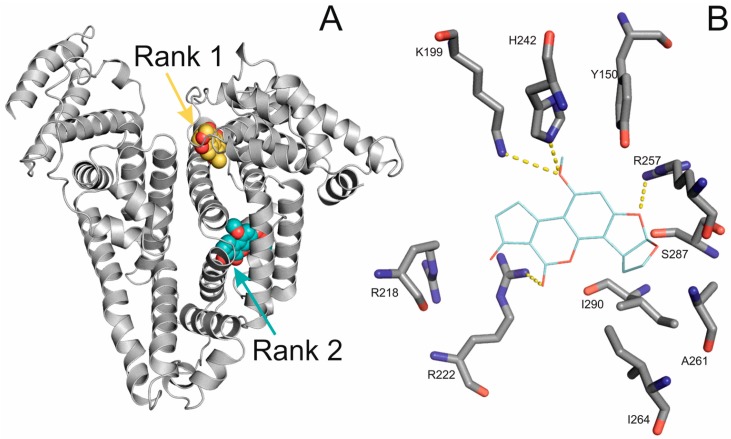
Figure 4.
HSA is represented with grey cartoon, and AFB1 conformation from the first rank is represented by yellow spheres, and AFB1 from the second rank is represented with cyan spheres (A); AFB1 is represented with cyan, thin sticks, and the interacting amino acids are represented with grey thick sticks (B).

